
Professional Stock Chart - Stock tracking & analysis
Track stocks with advanced charts, technical indicators, & portfolio management for informed investing decisions.
- 3.7.22 Version
- 4.5 Score
- 174K+ Downloads
- In-app purchases License
- 3+ Content Rating

About Professional Stock Chart
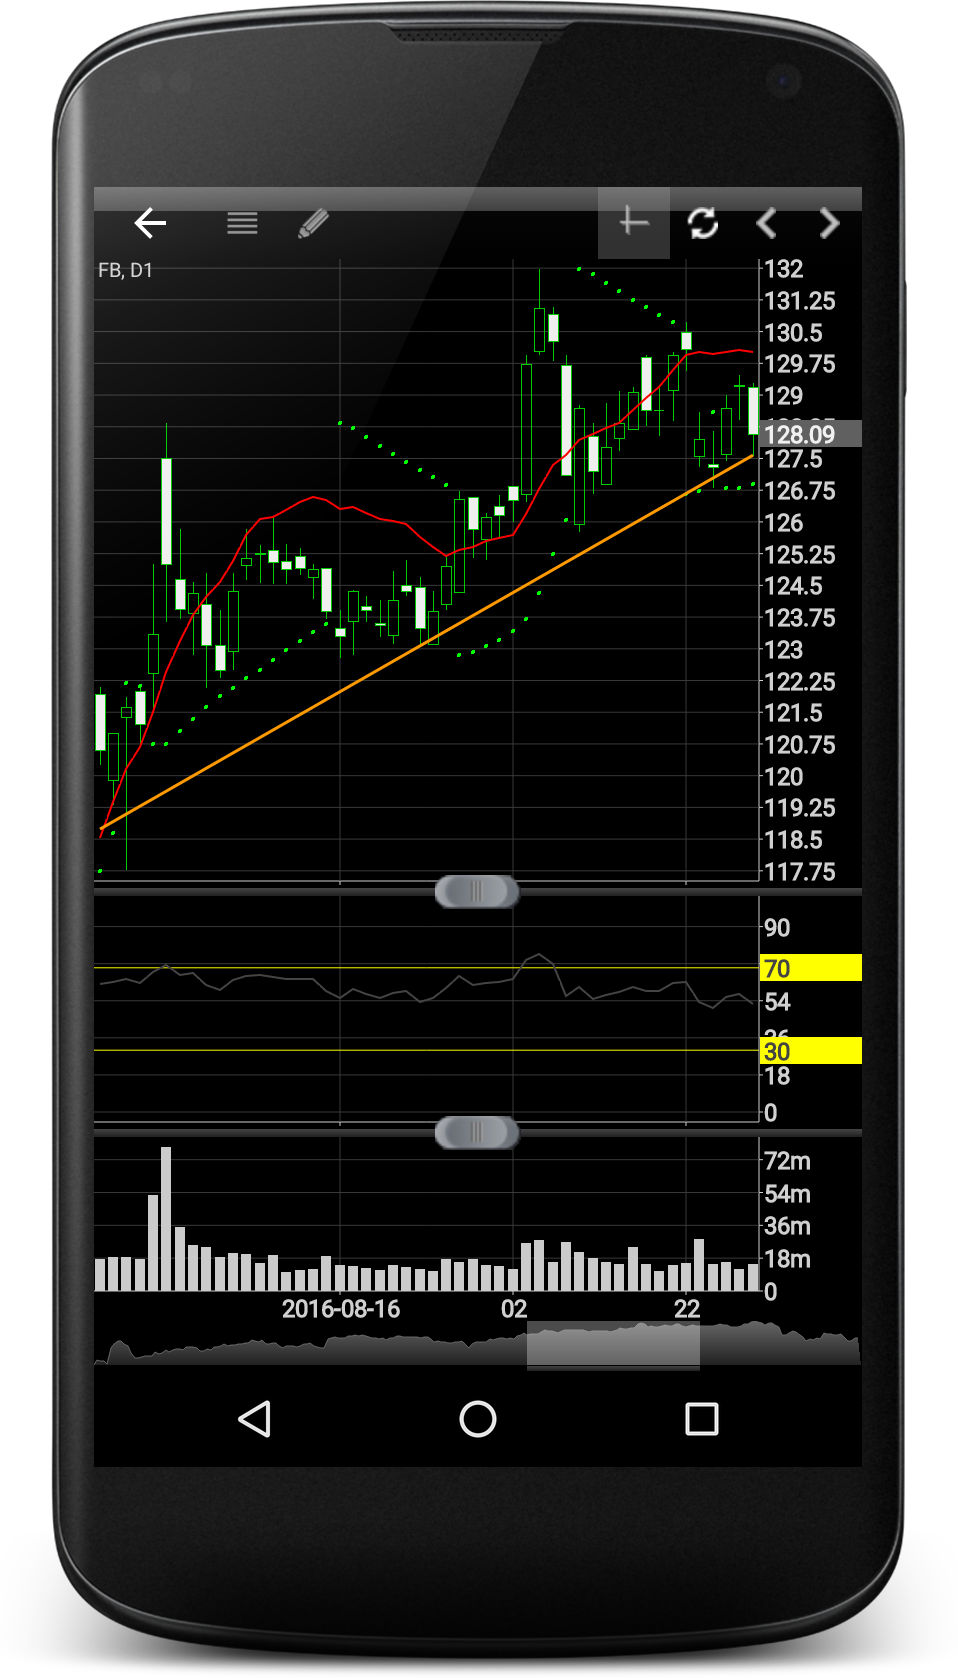
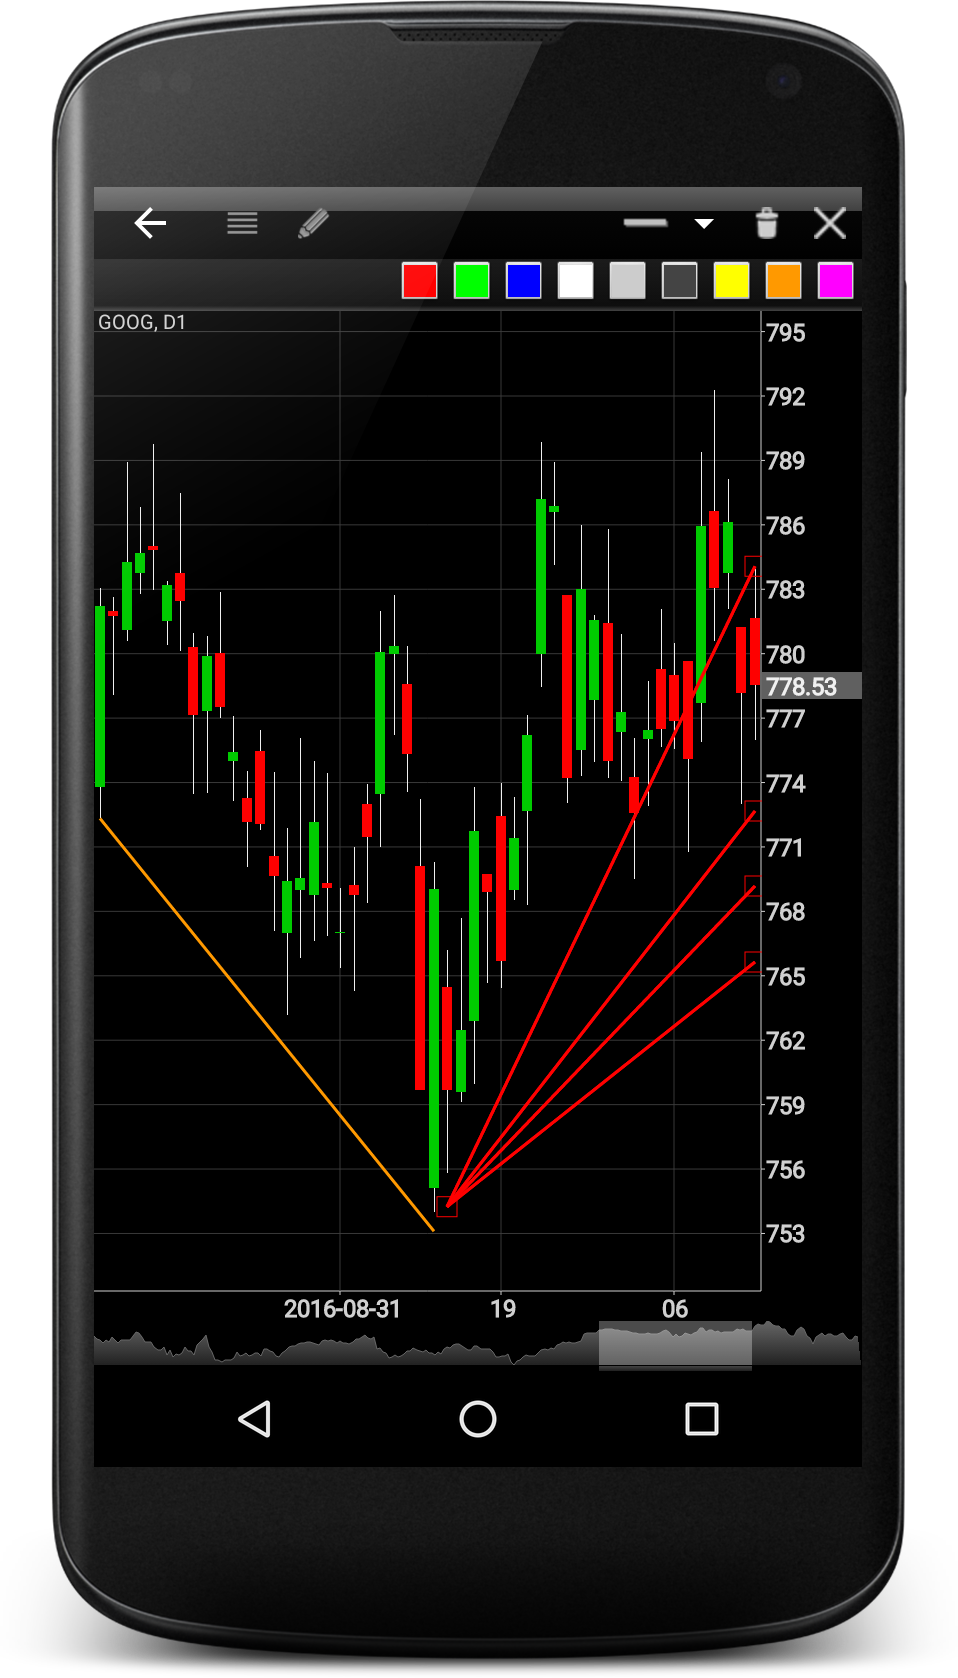
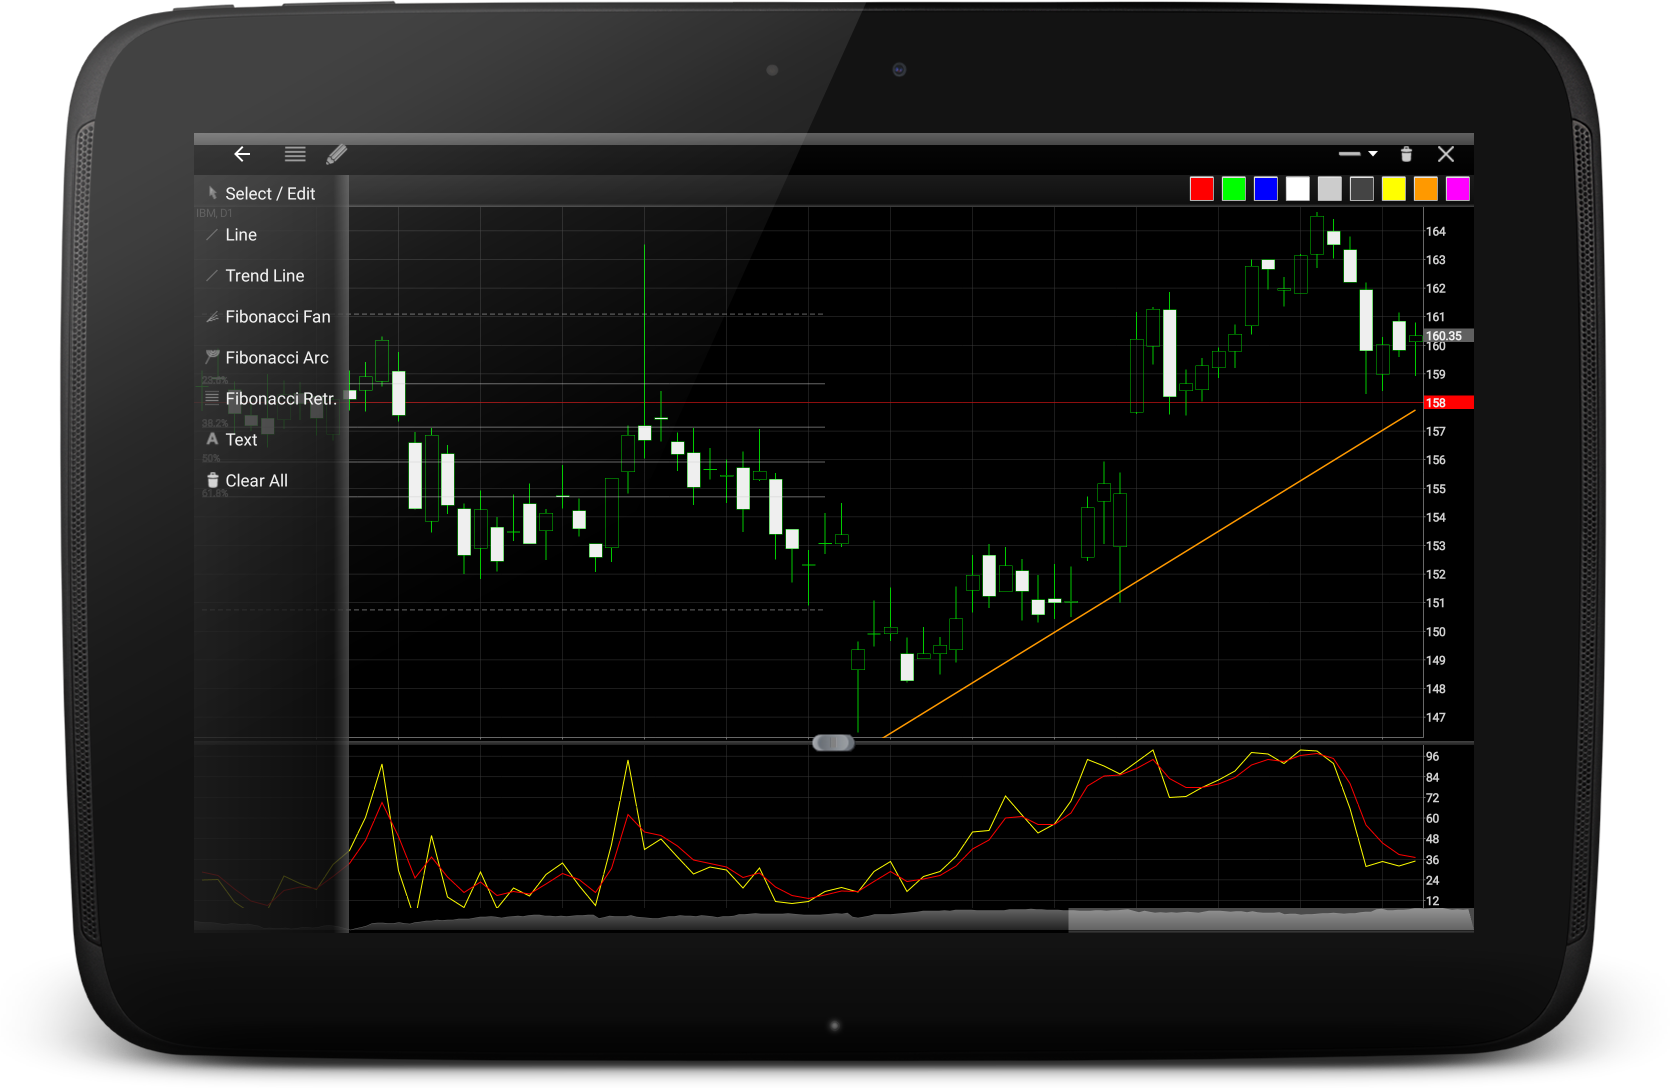
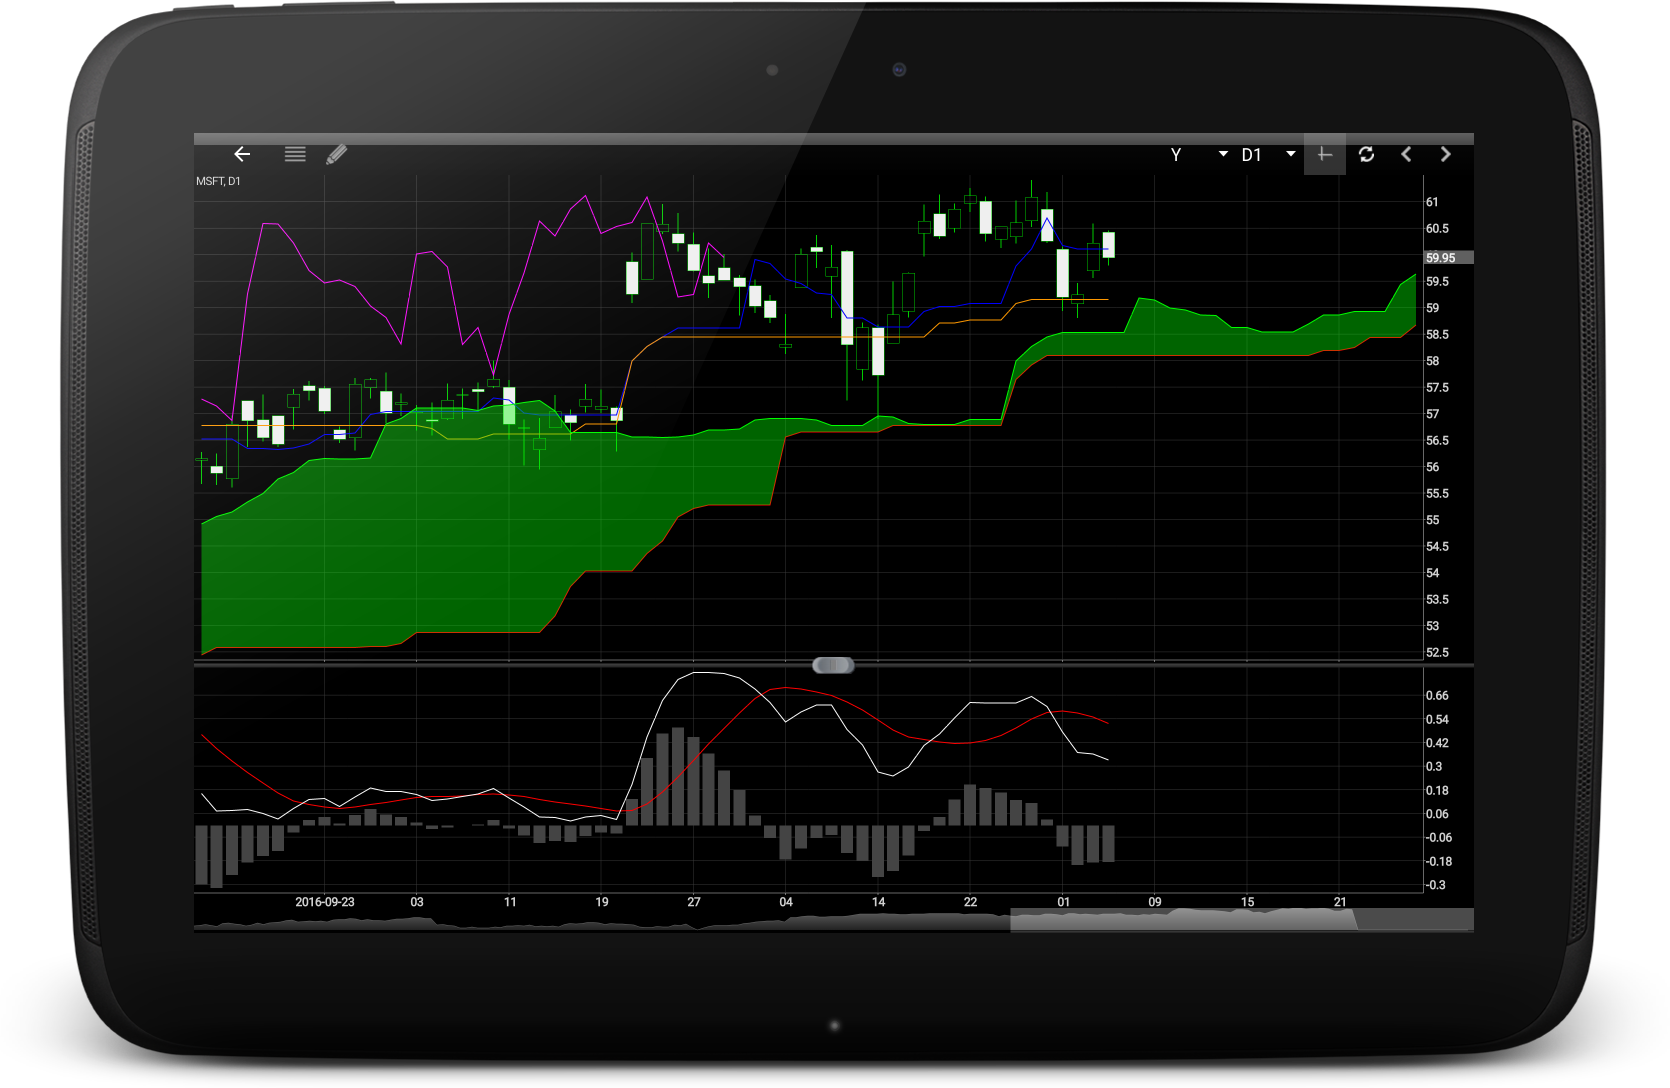
Professional Stock Chart is a stock tracking and technical analysis app for monitoring market movements and managing investment portfolios. Its interactive charts display historical price data and support four chart formats: Line, Area, Candlestick, and OHLC. Users can apply approximately 50 technical indicators, including Moving Averages, MACD, RSI, Parabolic SAR, Stochastic Oscillator, Williams %R, and Ichimoku, to examine price trends.
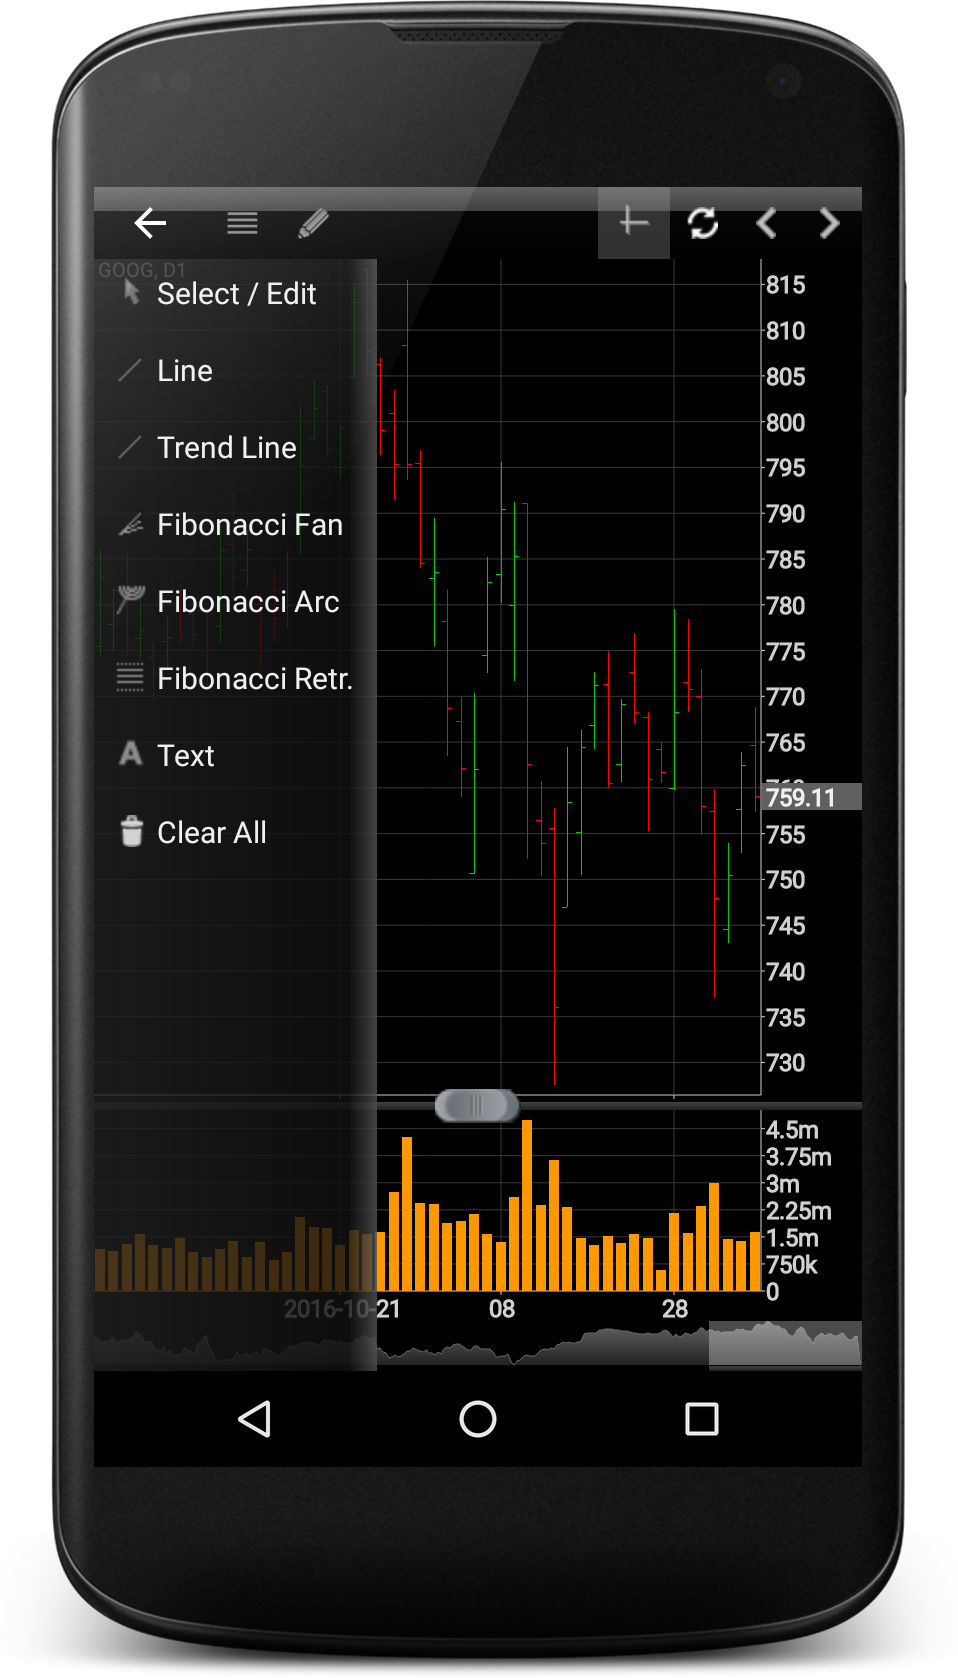
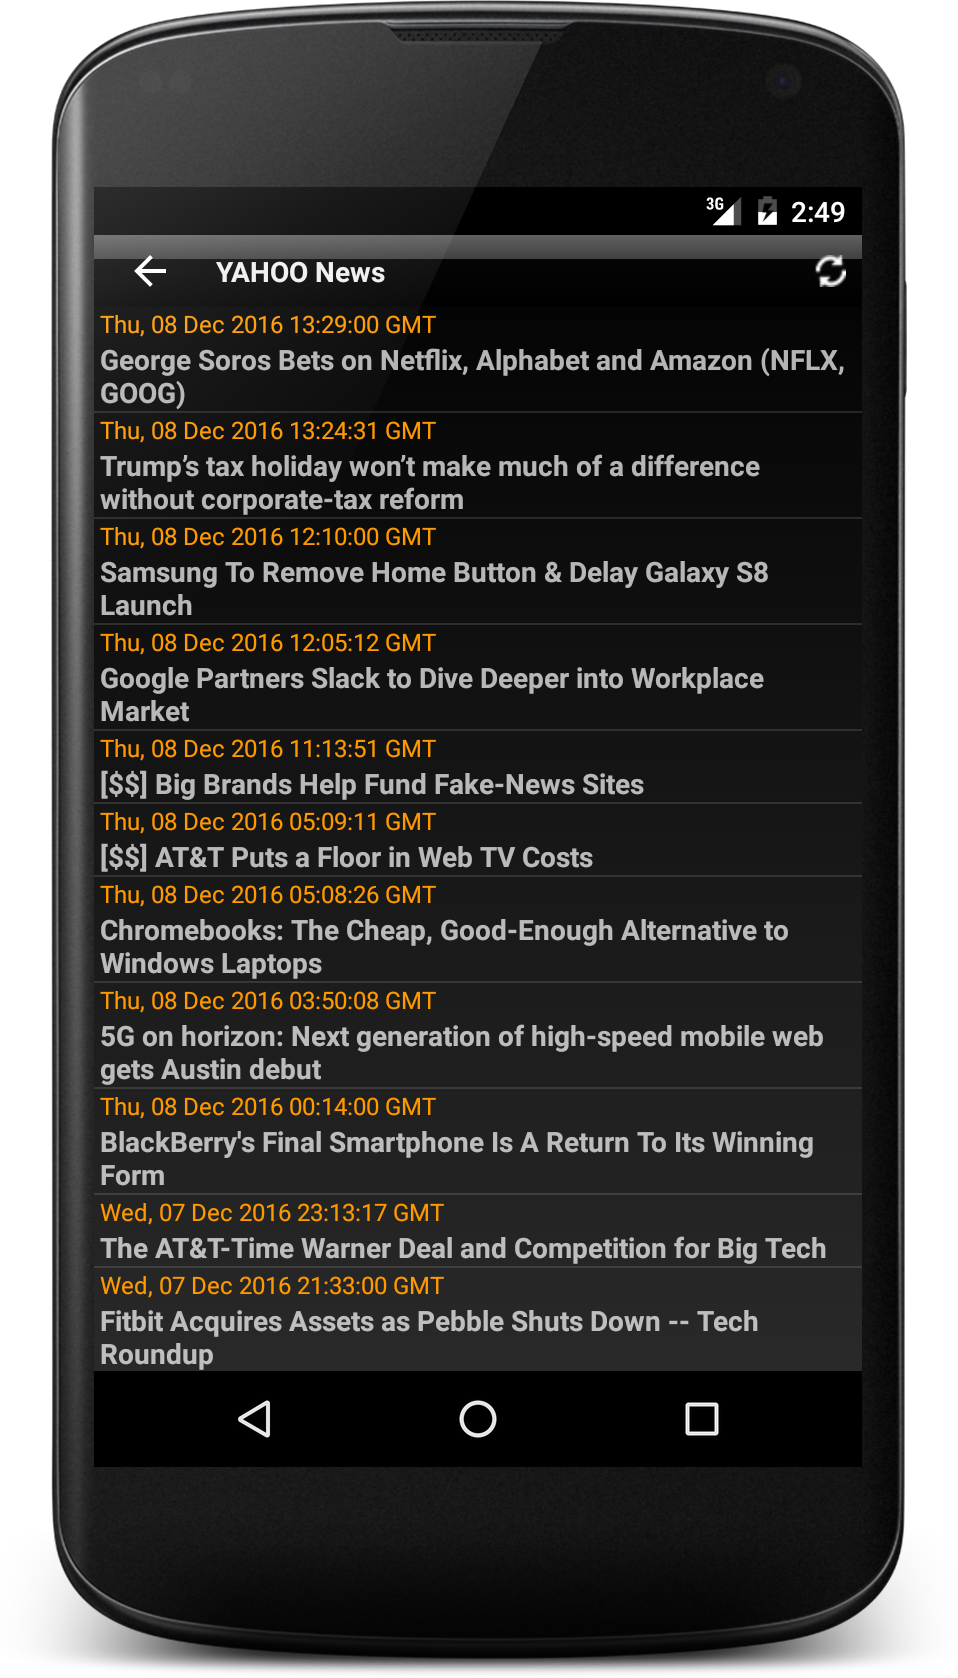
Chart controls include adjustable timeframes, pinch-to-zoom, crosshair tracking, drawing tools, and customizable themes. Supported intervals cover daily, weekly, monthly, and intraday price movements. The app also provides market news, price alerts, and offline chart access.
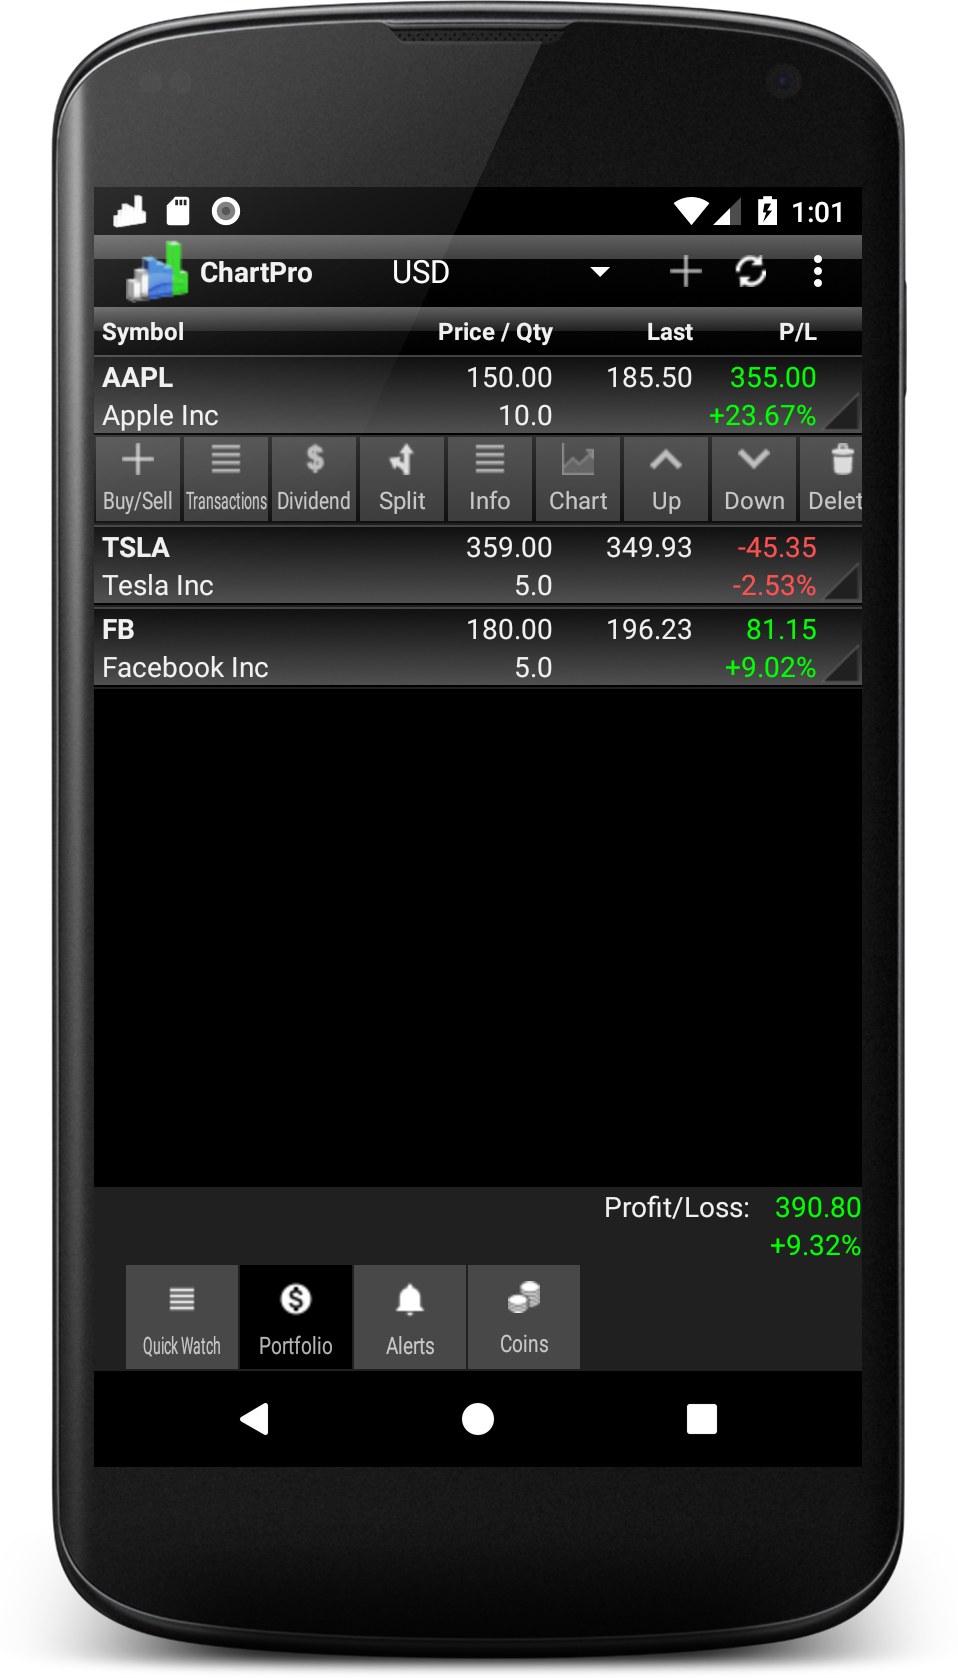
ChartPro includes a portfolio tracker for calculating position values and profits or losses based on purchase prices and available market quotes. It supports transaction histories, dividends, stock splits, and both long and short positions. Users can maintain multiple portfolios and watchlists to organize different investments and tracked symbols.
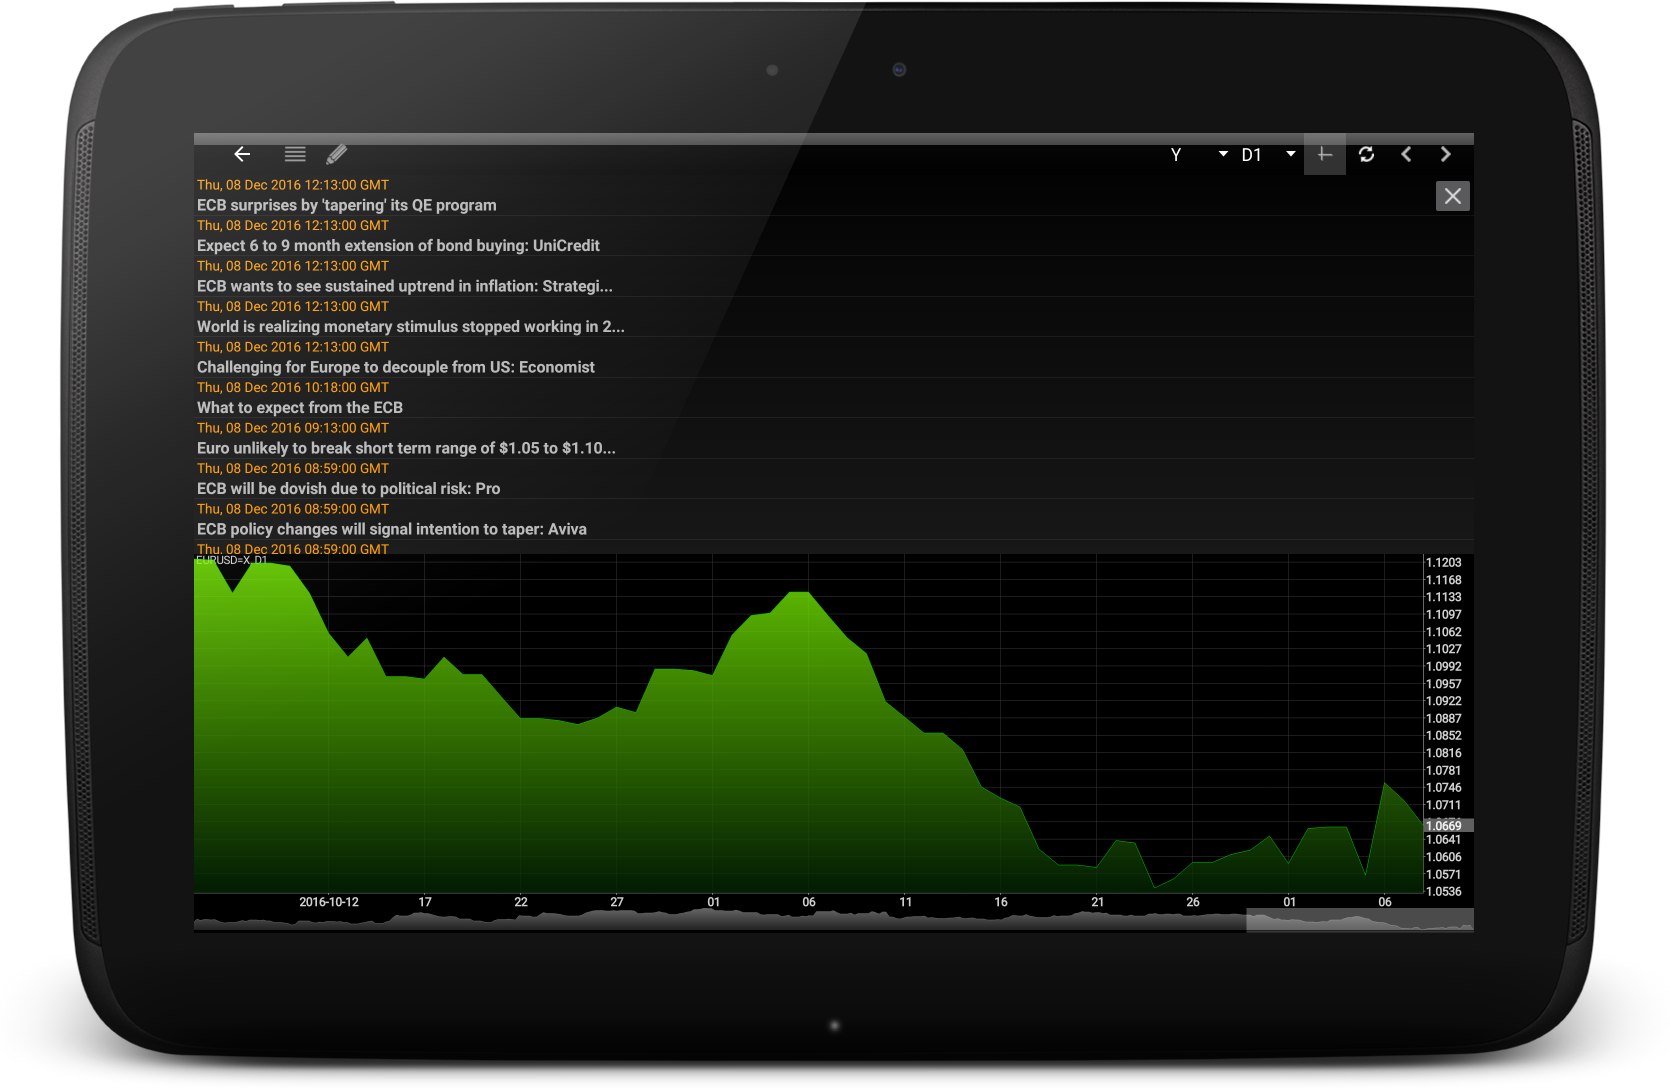
The app covers major stock markets in the United States, Canada, the United Kingdom, Germany, Australia, and India. It also supports currency pairs, although the free data provider does not offer Candlestick or OHLC data for forex symbols.
Key Features
Interactive Stock Charts: Examine historical price movements using pinch-to-zoom, crosshair tracking, and drawing tools.
Technical Analysis Indicators: Apply approximately 50 indicators, including MACD, RSI, Moving Averages, Parabolic SAR, and Ichimoku.
Multiple Chart Formats: Switch between Line, Area, Candlestick, and OHLC displays.
Flexible Timeframes: View daily, weekly, monthly, and supported intraday intervals.
Portfolio Tracking: Monitor position values and calculate profits or losses using transaction prices and available market quotes.
Transaction Management: Record purchases and sales, maintain transaction histories, and track dividends and stock splits.
Long and Short Positions: Manage both types of investment positions within a portfolio.
Watchlist Organization: Create multiple watchlists, sort stock symbols, and rearrange entries using drag-and-drop controls.
Price Alerts: Set custom conditions to receive notifications when specified market data meets defined criteria.
International Market Coverage: Track stocks across several major markets and monitor currency pairs.
Workspace Synchronization: Upload and download saved workspace configurations through the server synchronization feature.
How to Use ChartPro
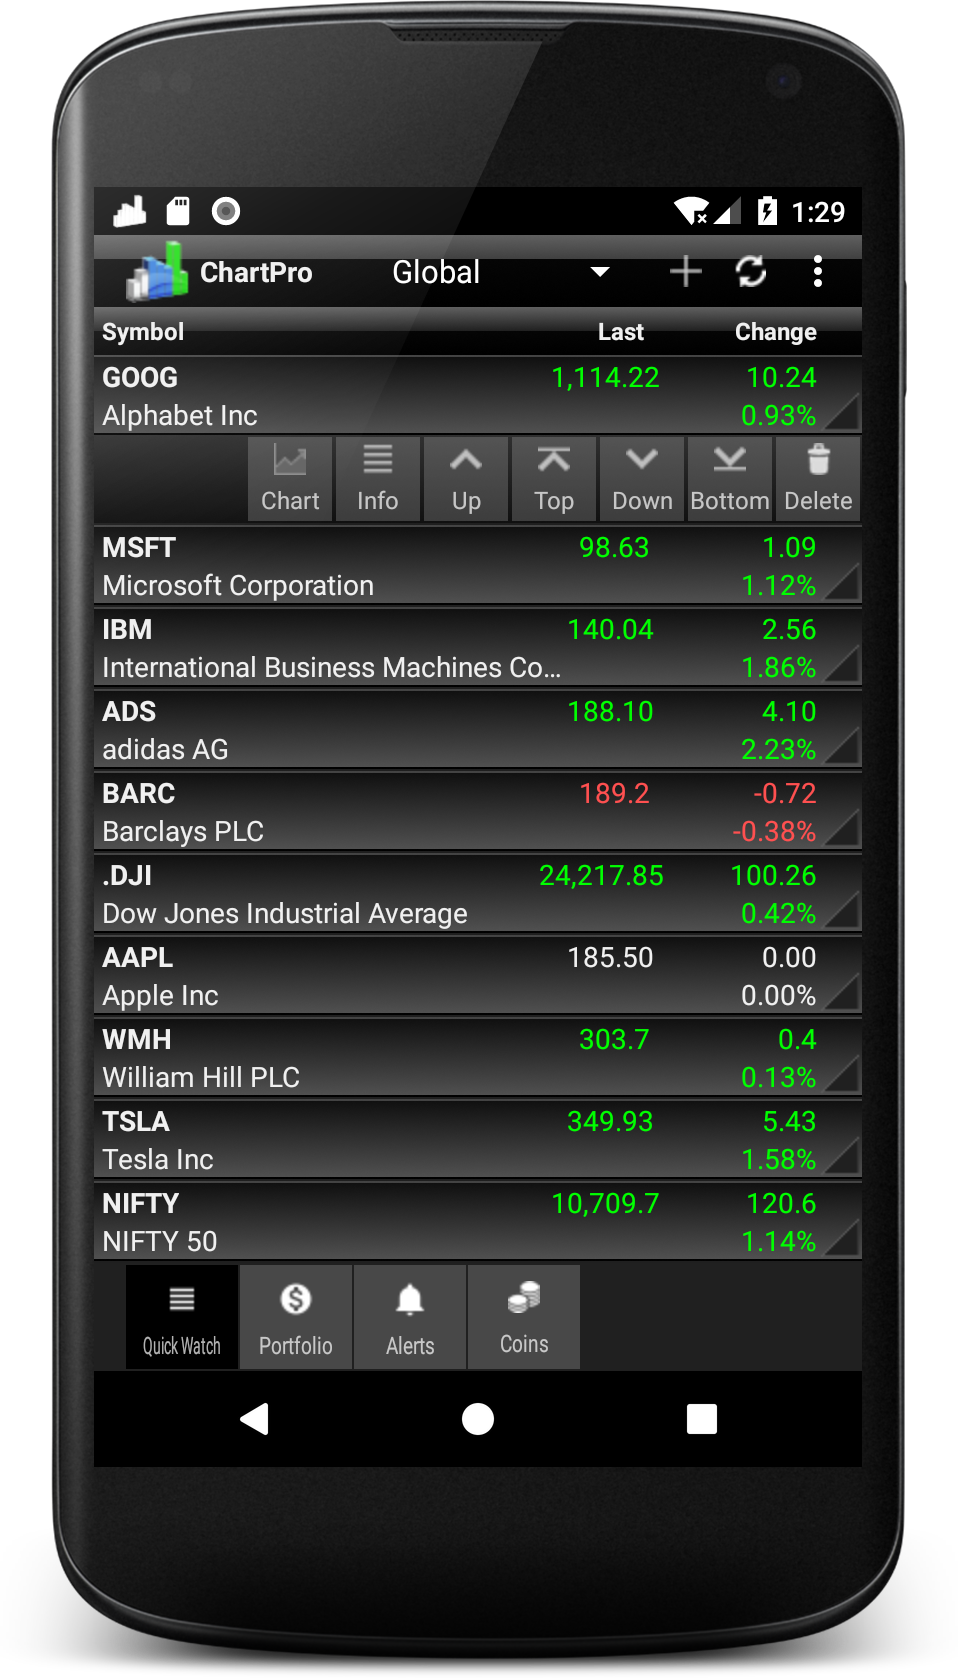
To track a stock, open Quickwatch and search for its company name or ticker symbol. Select the correct result to add it to your watchlist. Open the stock to view its chart, change the display format, adjust the timeframe, or apply technical indicators.
To manage investments, go to the Portfolio section and add a stock by selecting its ticker and entering the transaction details. Once a position has been created, use its context menu to record additional purchases or sales, manage dividends, and update position information. The portfolio tracker recalculates position values and profit or loss figures using available market quotes.
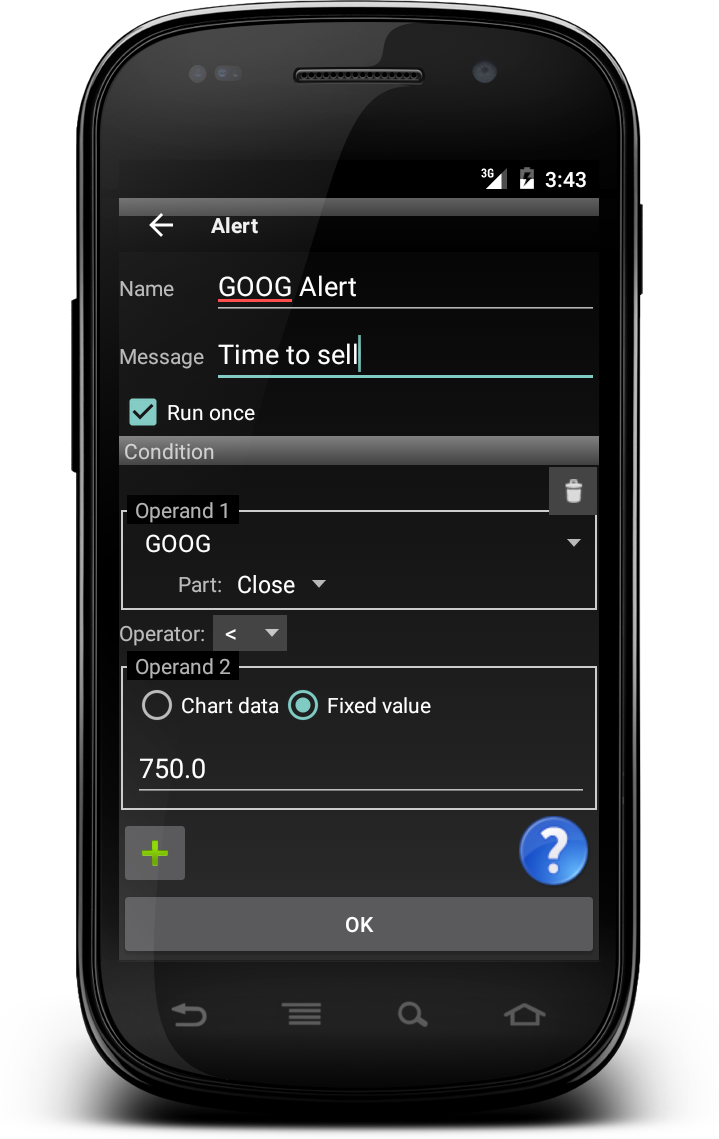
For price monitoring, open the chart menu and select Alerts. Create an alert by entering a name and message, then defining the conditions that trigger it. You can also save chart configurations as templates and apply them to other stocks. To transfer workspace settings between devices, configure an email account and use the workspace synchronization feature.
FAQs
1. How do I add a stock to Quickwatch?
Open the Quickwatch tab and tap the Add button in the title bar. Enter a company name or ticker symbol, such as GOOG, and select the correct search result. The stock will then appear in your watchlist.
2. How do I create a portfolio position?
Go to the Portfolio tab and tap Add. Search for the stock, select the correct symbol, enter the transaction details, and tap Add to create the position.
3. How do I record another transaction for an existing position?
Open the context menu for the relevant portfolio position and select Buy/Sell. Enter the details of the additional purchase or sale to update its transaction history.
4. Why do closed positions still appear in my portfolio?
ChartPro retains closed positions by default so you can review completed investments. To remove them, open Portfolio settings and select Remove closed transactions.
5. How can I view intraday stock data?
Open the chart's main menu, navigate to Settings, and select a supported interval, such as five minutes. Available intervals depend on the data provided for the relevant stock exchange.
6. Can I use Candlestick charts for currency pairs?
The free data provider does not supply Candlestick or OHLC data for forex symbols. Consequently, these chart formats are unavailable for currency pairs through this provider.
7. Why is data unavailable for certain stock symbols?
ChartPro uses Yahoo as its default data source and may switch to Google for certain exchanges. Automatic symbol mapping can sometimes fail, preventing quotes and historical data from loading.
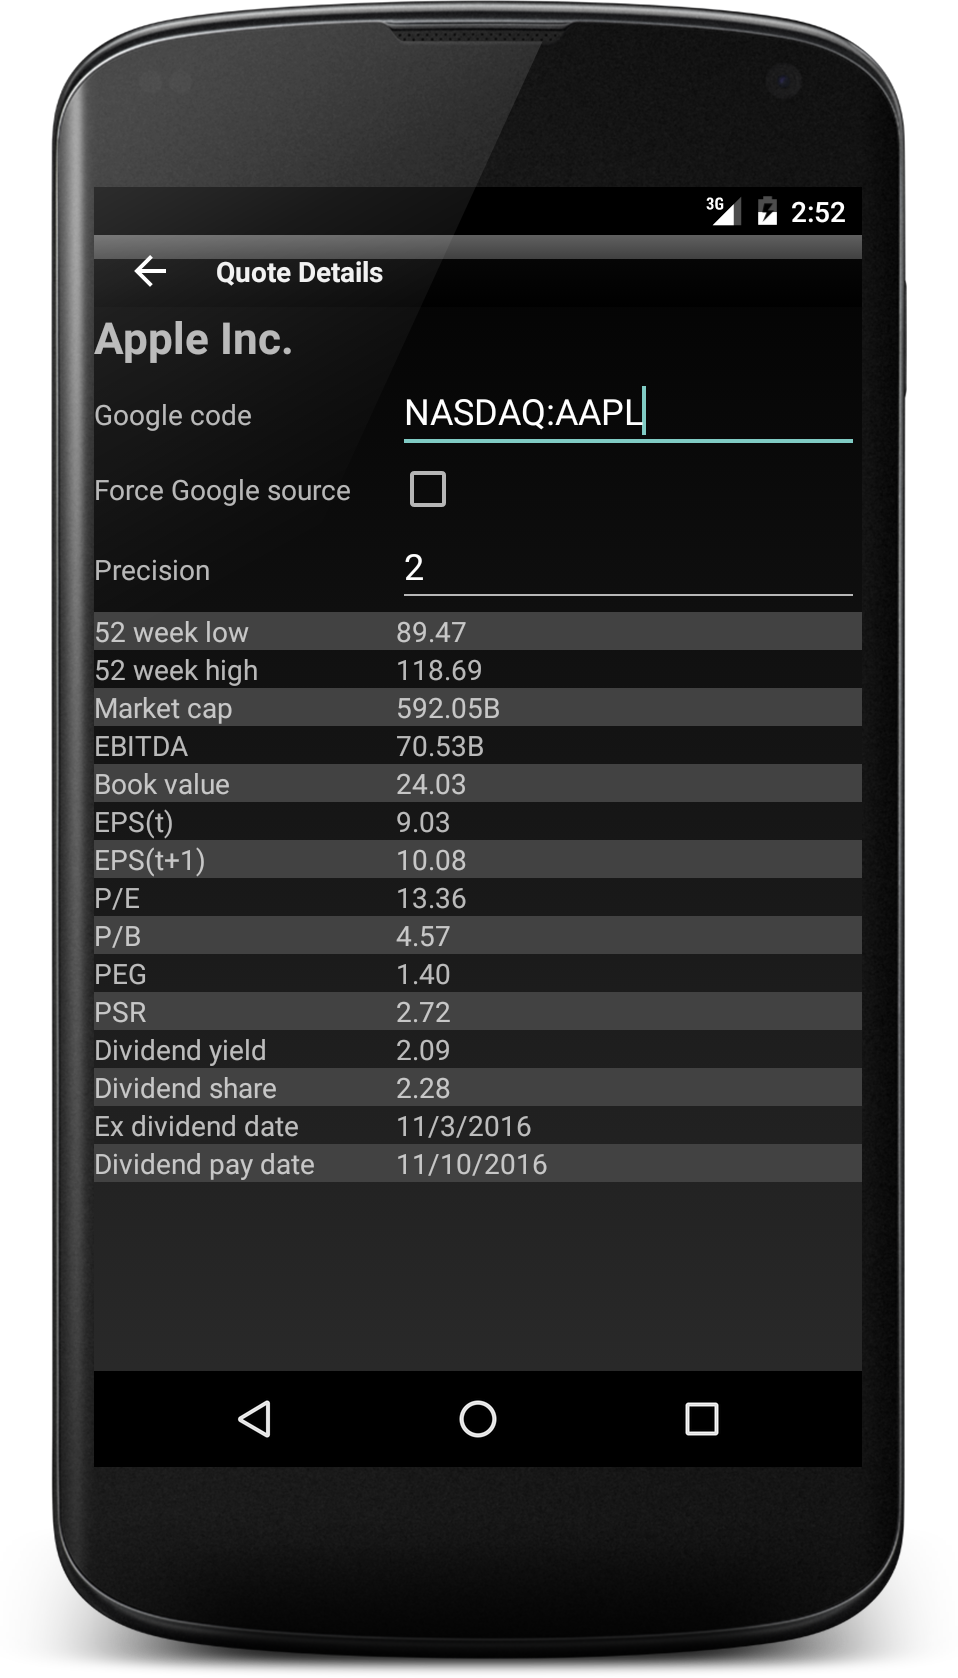
To correct the mapping, open the symbol's context menu, select Info, and enter the appropriate Google Finance code in the relevant field. Save the changes and refresh the data.
8. How do I set up a price alert?
Open the chart menu and select Alerts, then create a new alert. Enter a name and message, and define the triggering condition using two data operands and a comparison operator. For example, you can compare a stock's closing price with a fixed value or another market data field.
9. Can I apply the same chart settings to multiple stocks?
Yes. Select Save template from the chart's main menu to store the current configuration. You can then apply the template to other charts. If a chart already has customized settings, you may need to select Reset settings from its Settings menu before applying the template.
10. What should I do if ChartPro displays a download error?
Download errors may occur when the data server is temporarily unavailable, the internet connection is unstable, or an ad blocker prevents access to the required server. Check your connection and refresh the data. If the problem persists, contact the app's support team.
- Version3.7.22
- UpdateNov 20, 2026
- Developerprostockchart.com
- CategoryFinance
- Requires AndroidAndroid 8.0+
- Downloads174K+
- Package Namecom.taguru.ChartPro
- Signature3b2361a91b6b00855ccf7ec7d0faf80b
- Available on
- ReportFlag as inappropriate
-
NameSizeDownload
-
7.89 MB
-
7.89 MB
-
7.80 MB












Fast overview of stocks using technical charts.
Excellent charting capabilities and tools.
User-friendly interface for traders and investors.
Ability to use multiple indicators in one window.
Option to track various stocks and create custom charts.
Good visual quality of charts and information on reports.
Ability to select different data providers for stock info.
Dedicated support for queries from the developers.
Lack of intraday chart options for free users.
Missing candlestick data for specific stocks.
Frequent crashes and freezing issues.
Annoying full-screen video ads with loud audio.
Limited customization options for indicators and time frames.
Occasional inaccuracies in data and volume reporting.
Difficulty syncing changes across devices.
Issues with app features like watch list management and template usage.