Air Quality & Pollen - AirCare - Air quality tracking & alerts
Stay informed on air quality, pollen counts & UV levels with real-time updates for a healthier lifestyle!
- 8.91.010 Version
- 3.0 Score
- 208K+ Downloads
- In-app purchases License
- 3+ Content Rating


AirCare - the essential application for monitoring air quality, pollen levels, and UV exposure! It has been recognized by Forbes, BBC, NASA, Google, and has received accolades from the United Nations.
Features include:
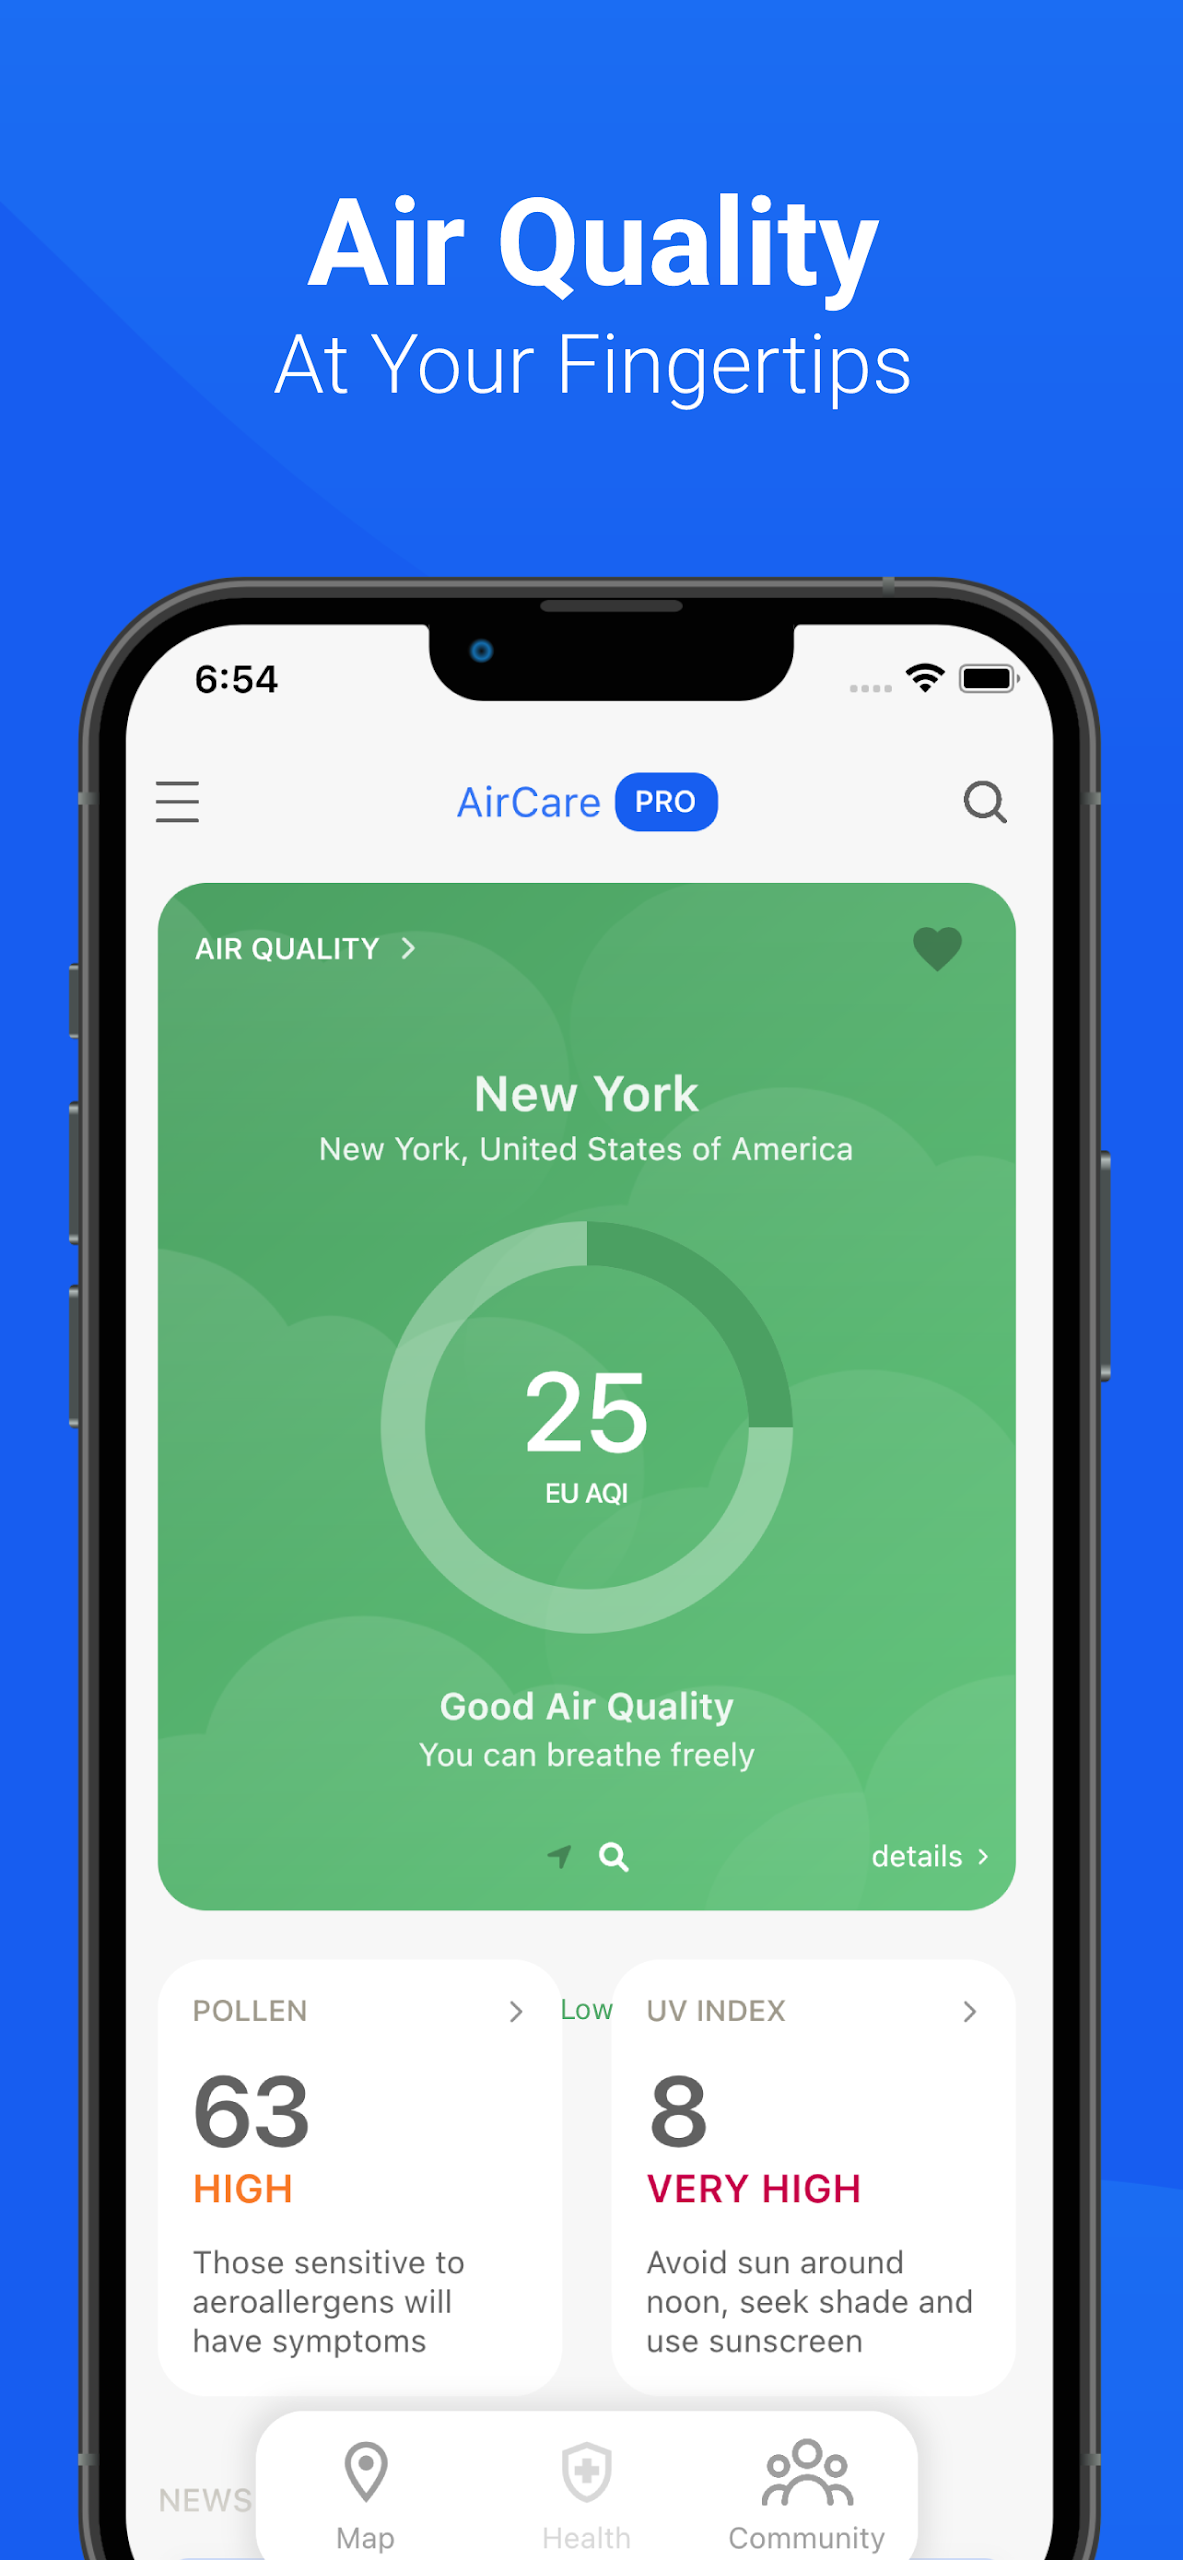
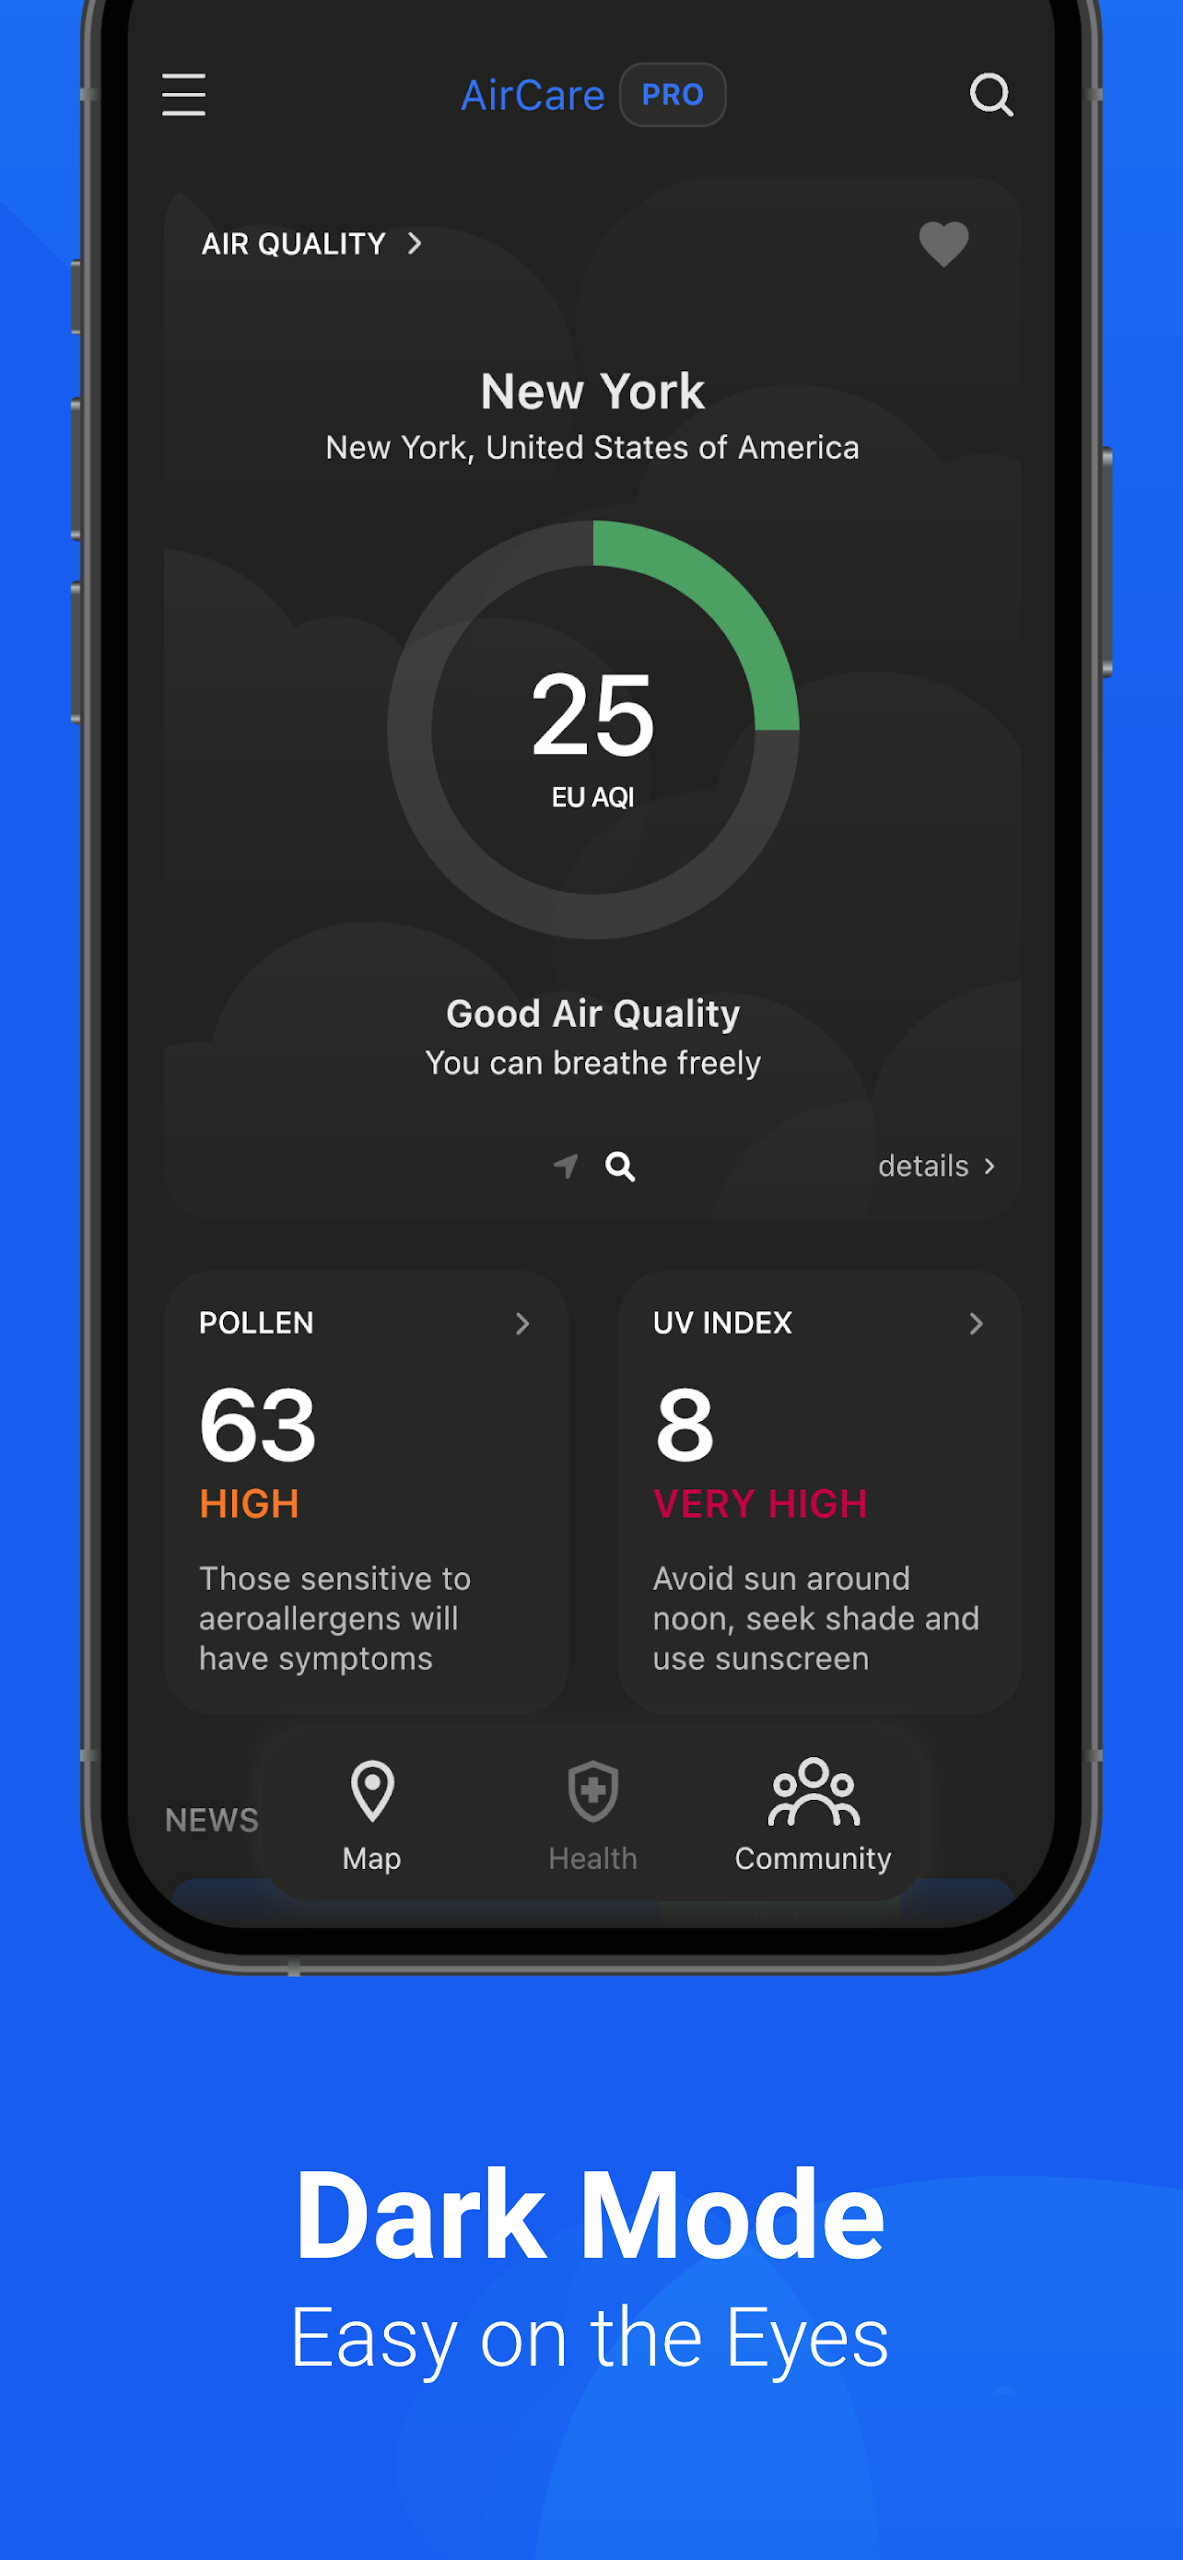
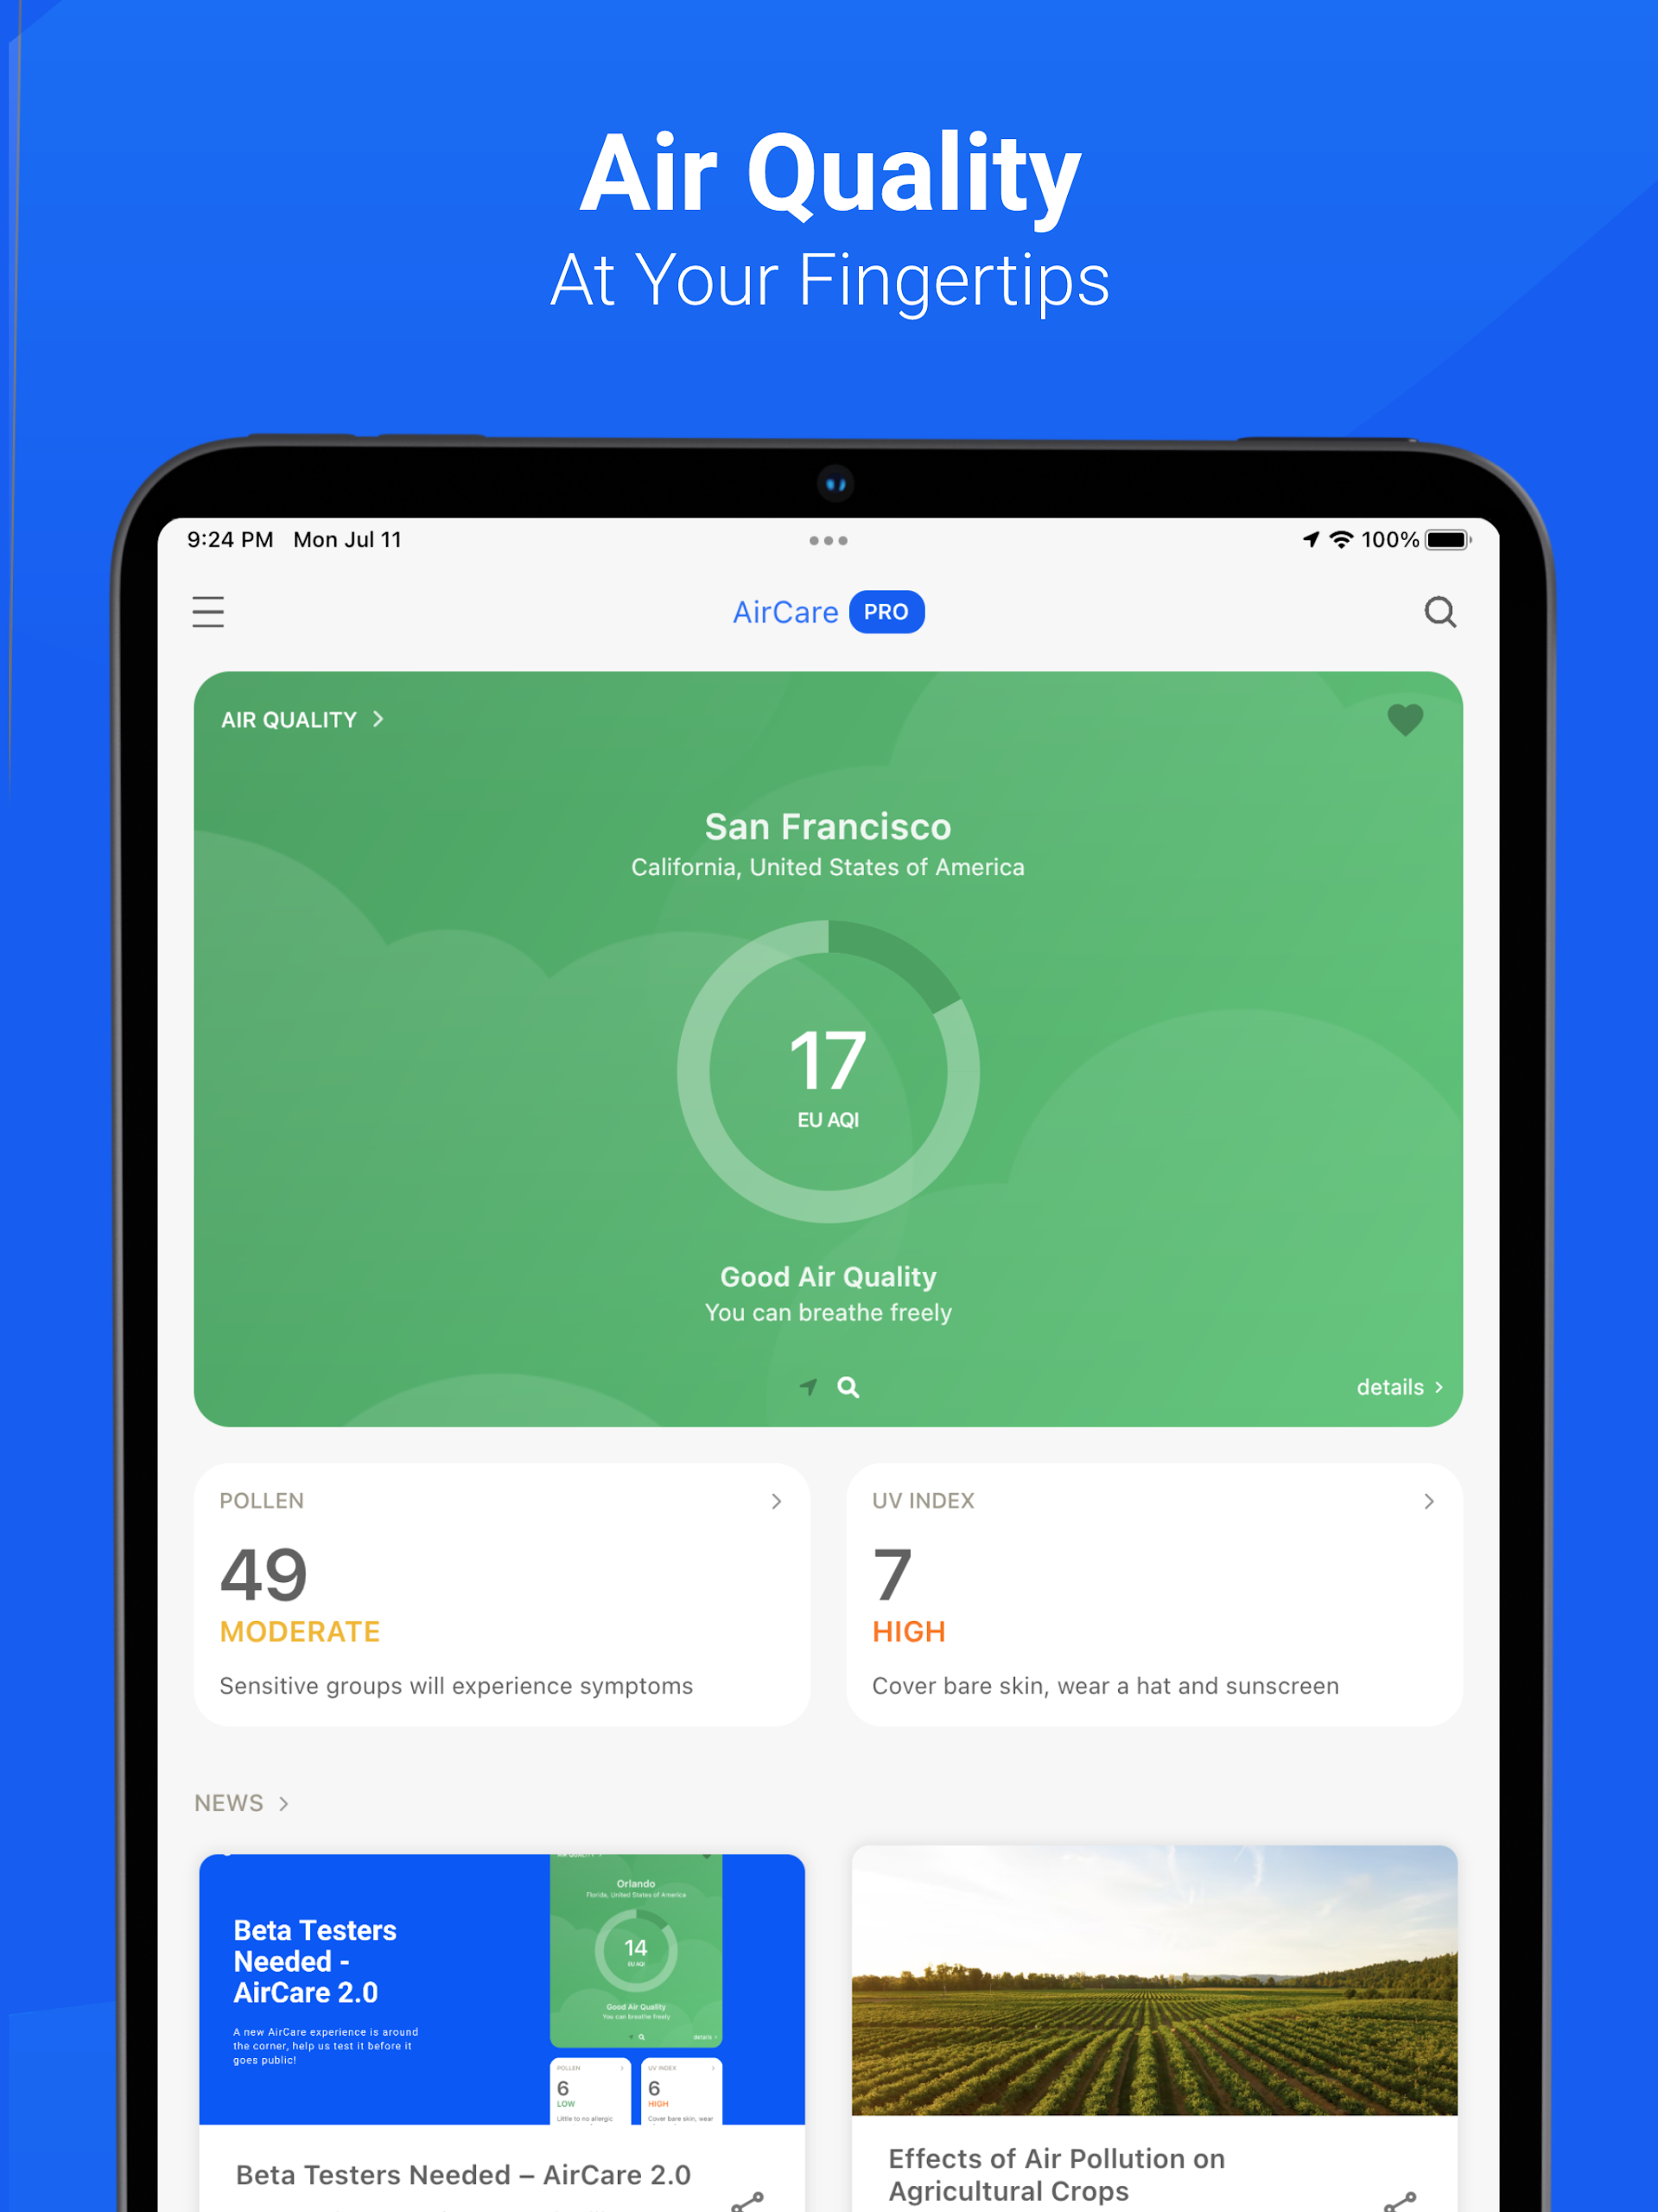
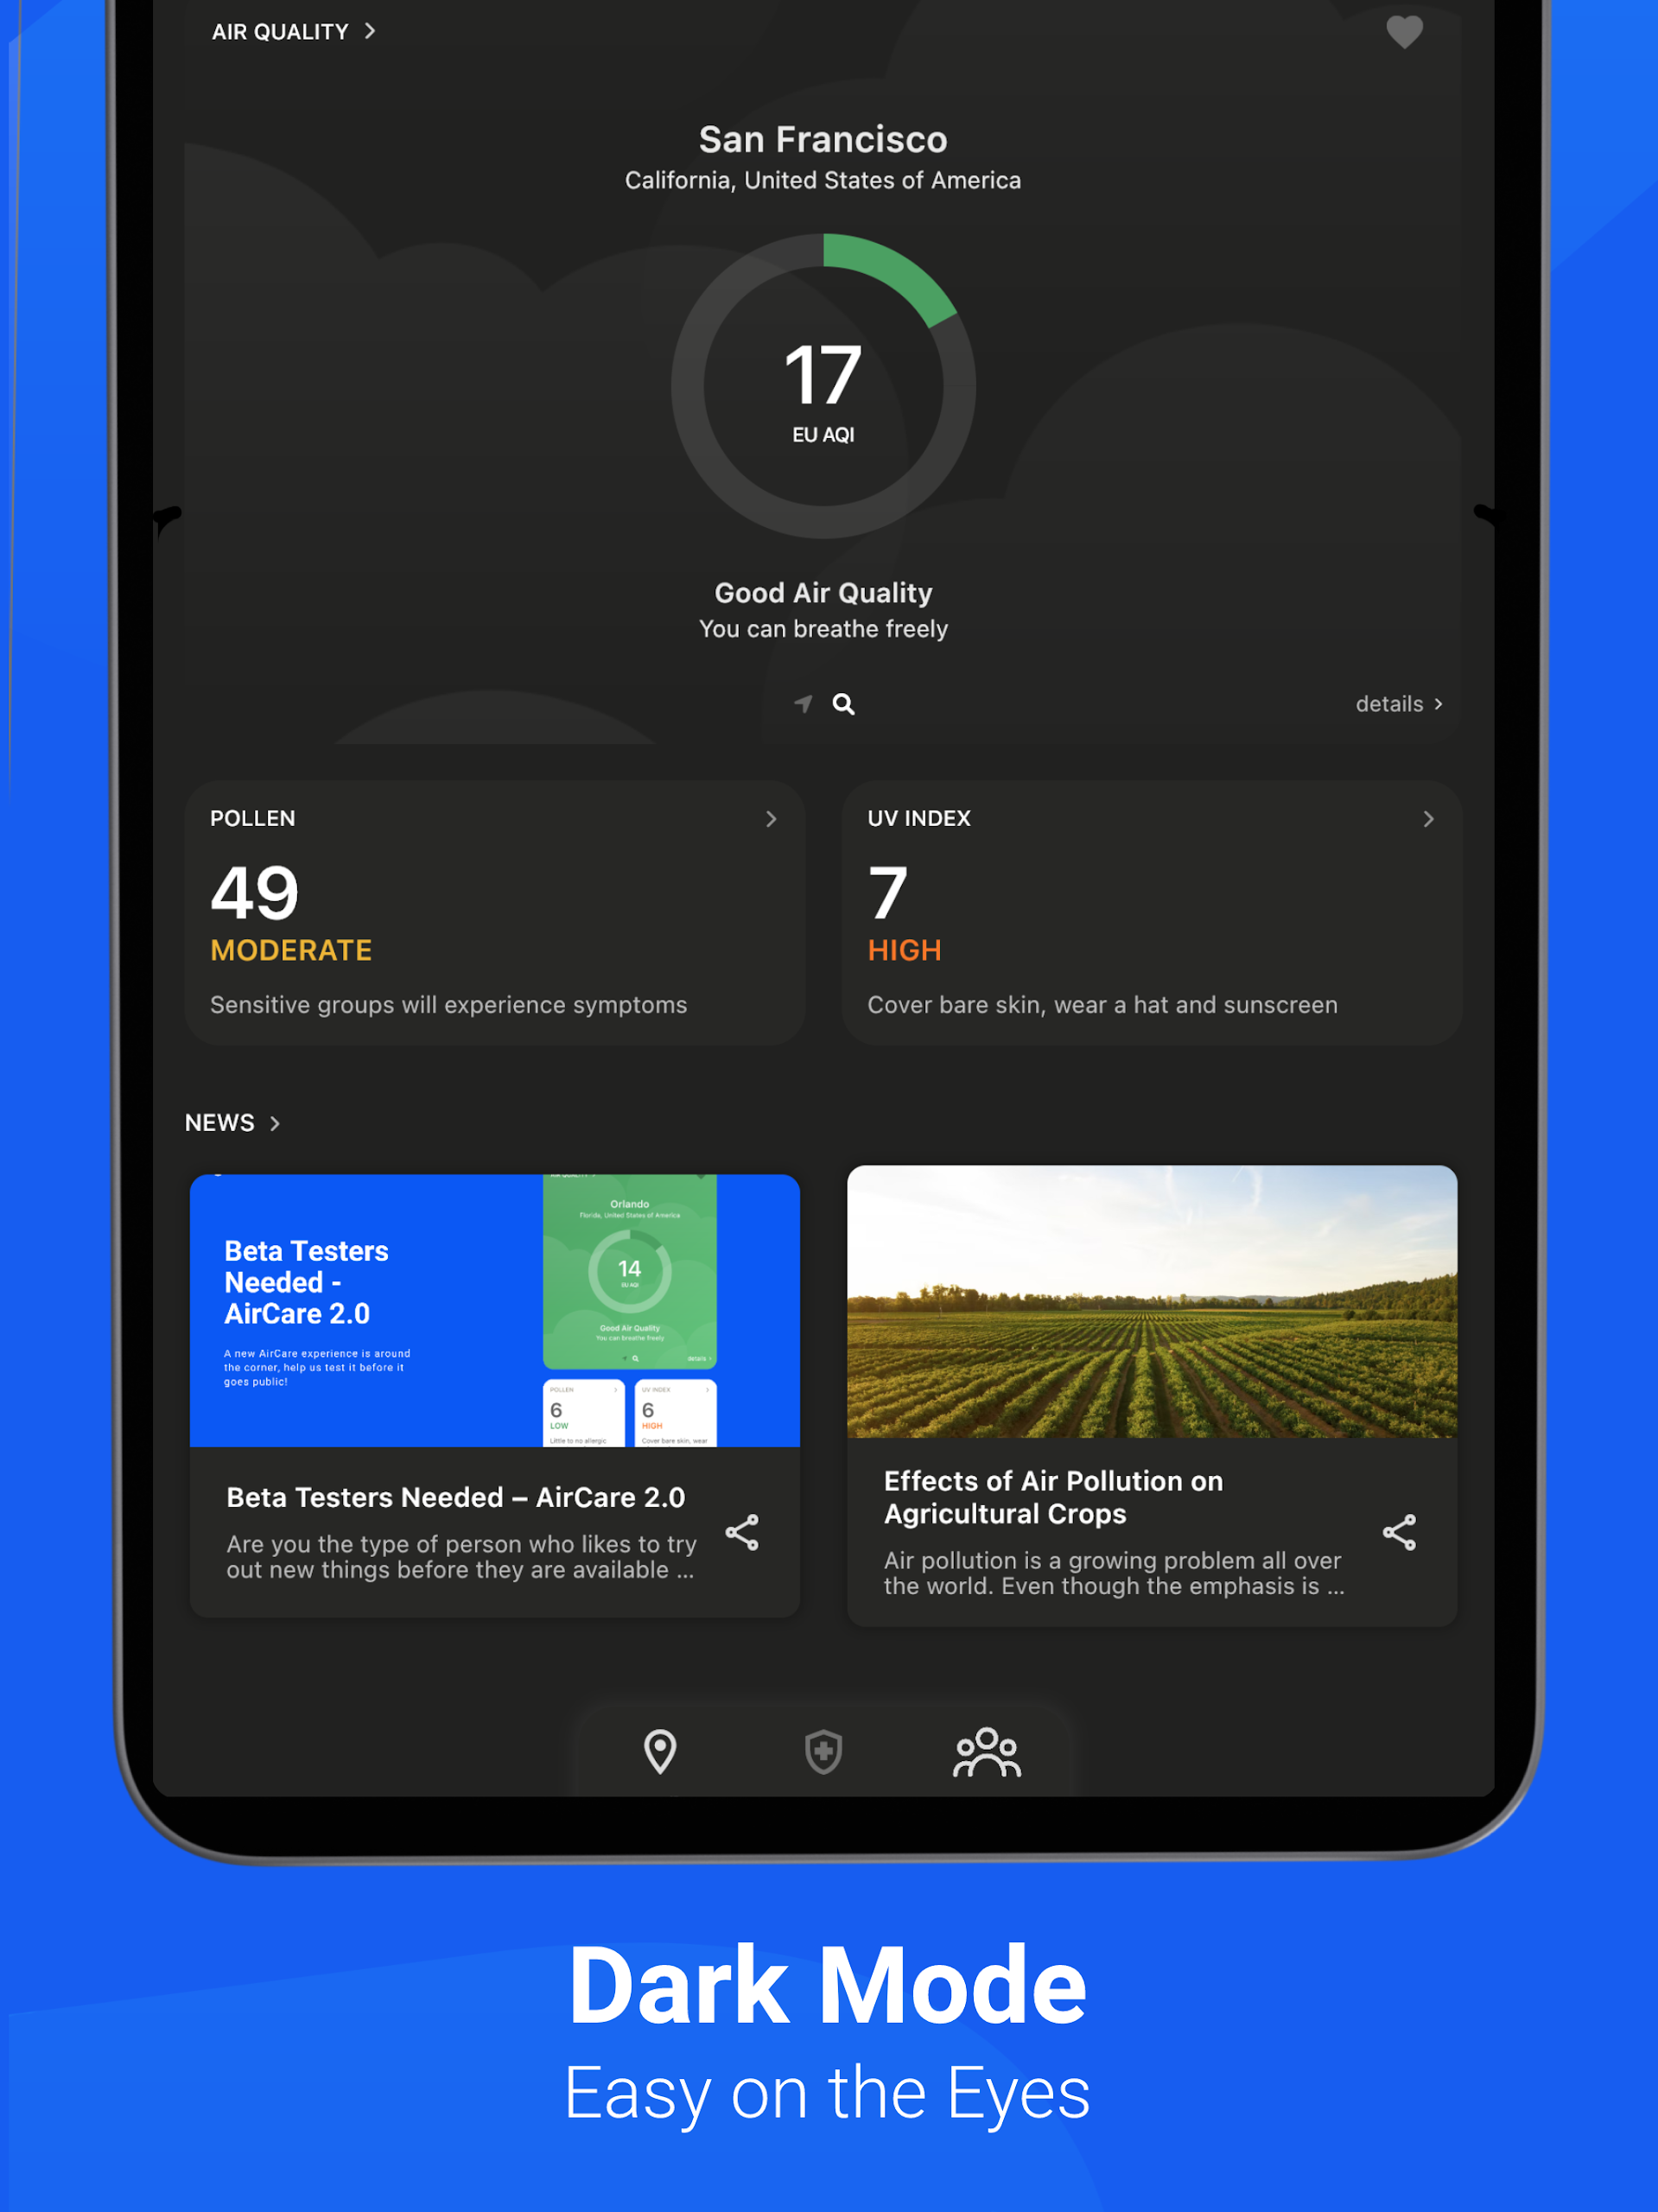
- AQI - Air Quality Index: Protect yourself from air pollution anywhere in the world.
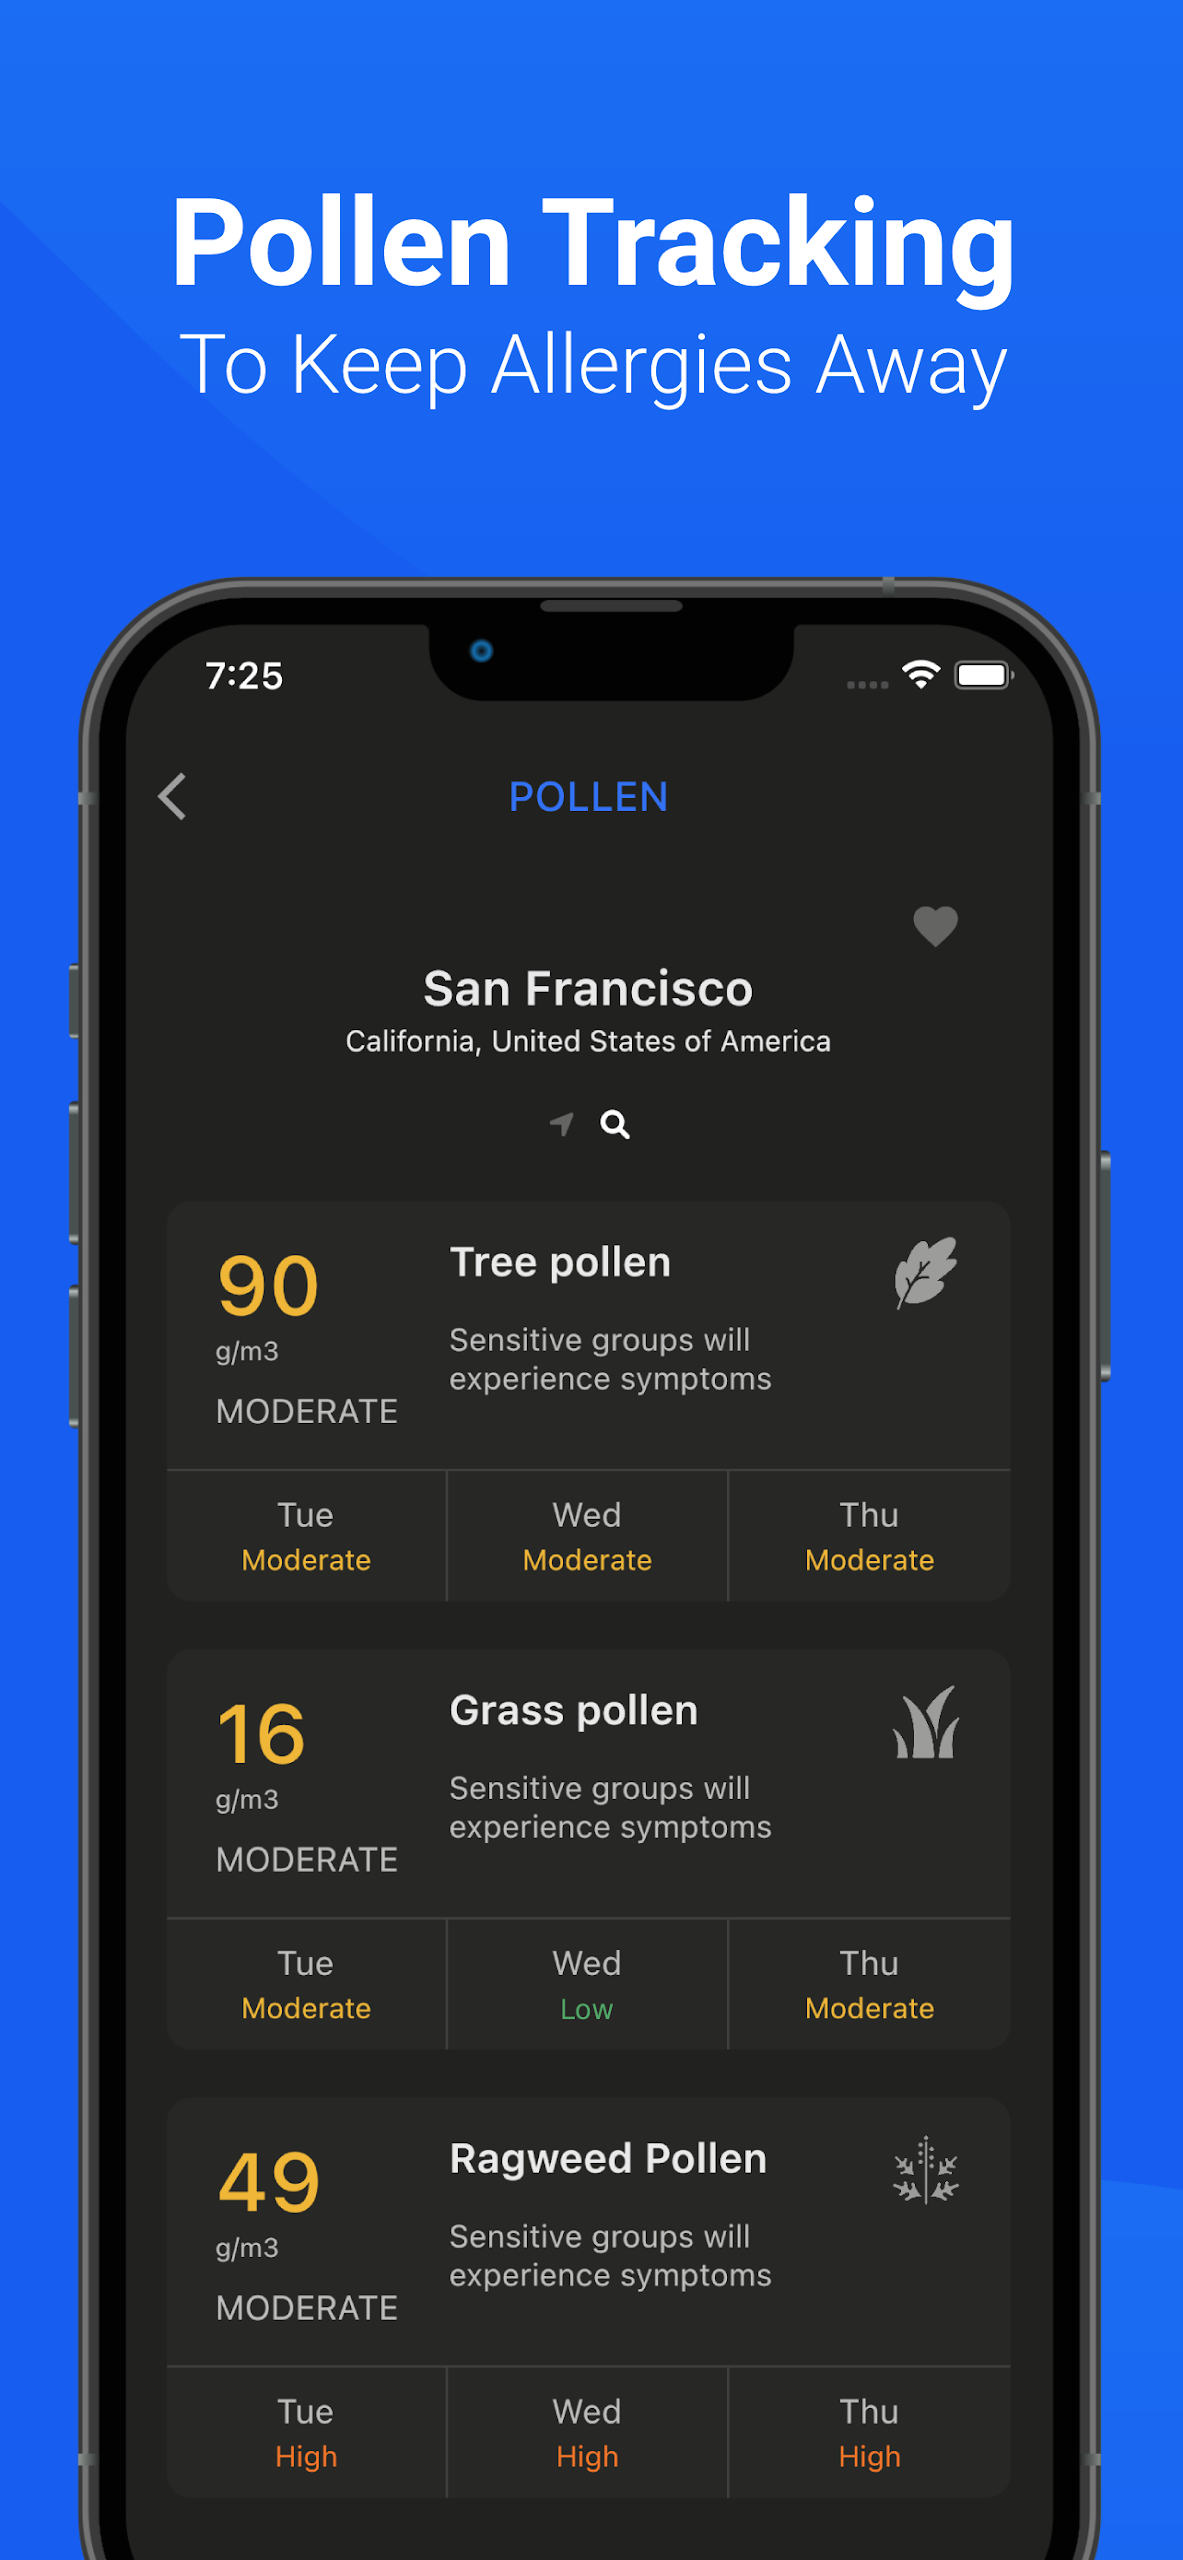
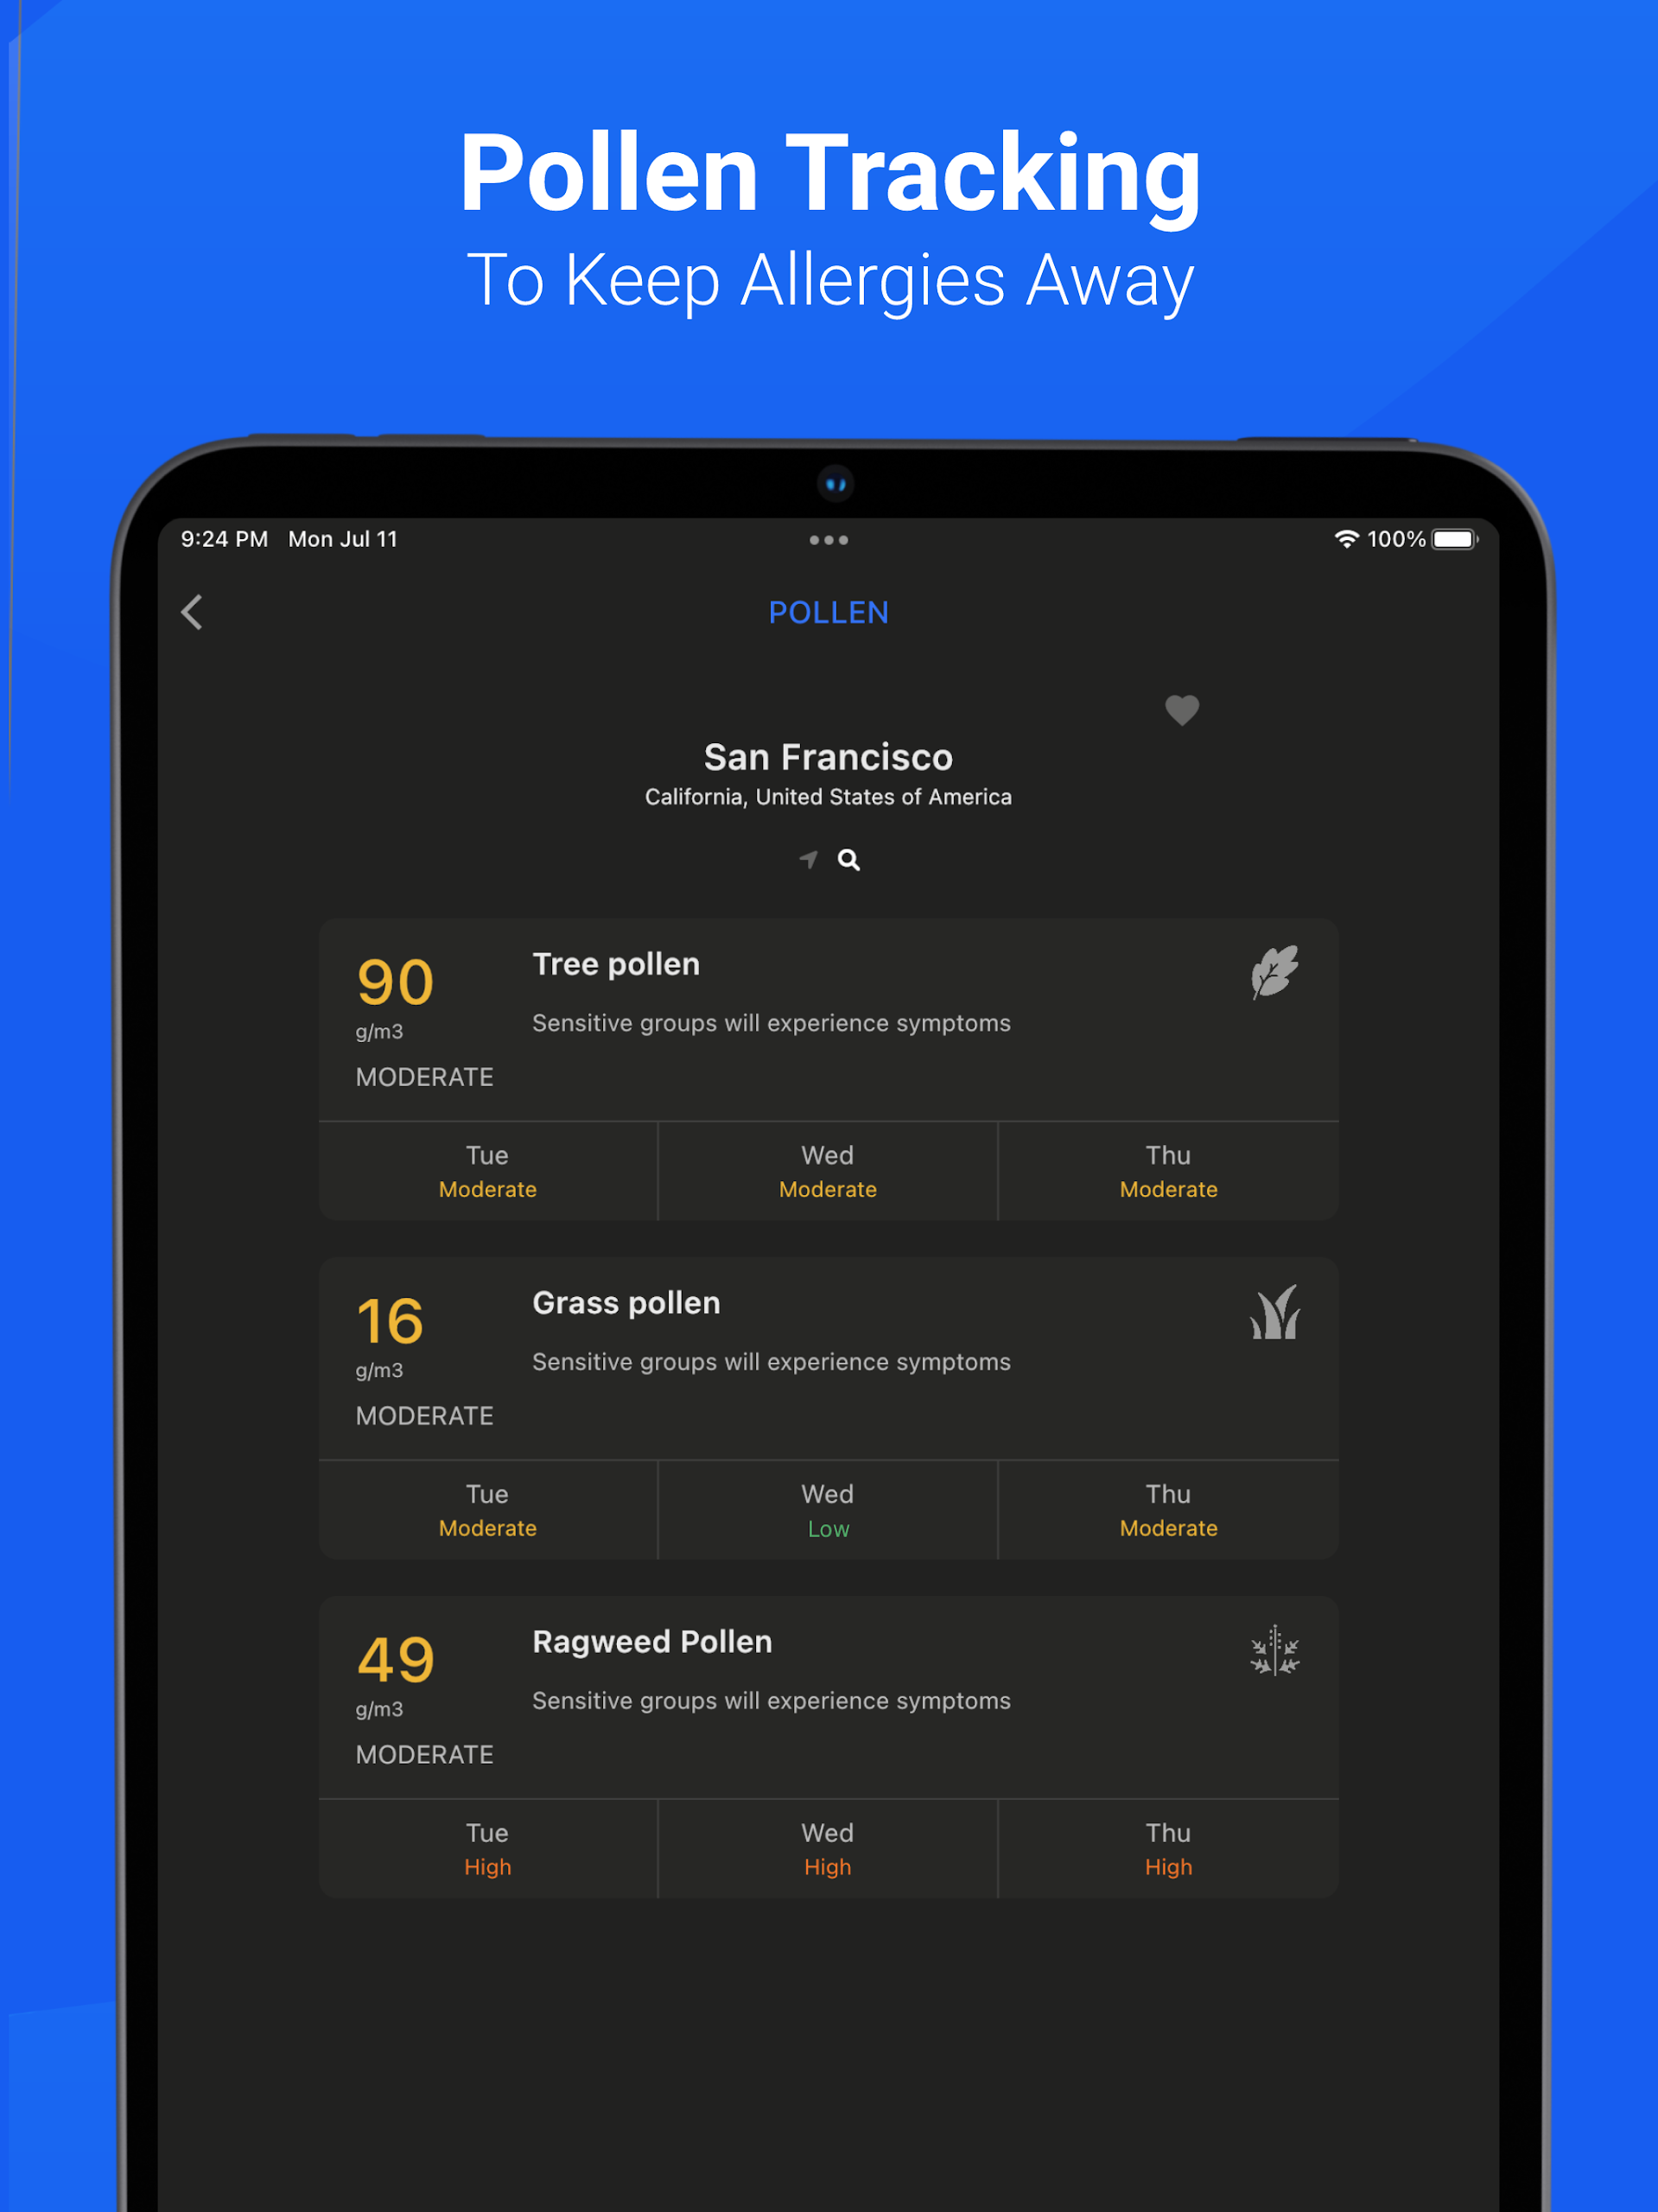
- Pollen Monitoring and Forecasts: Minimize allergic reactions by tracking three forms of pollen in the US and Europe (Tree, Grass, and Weed Pollen).
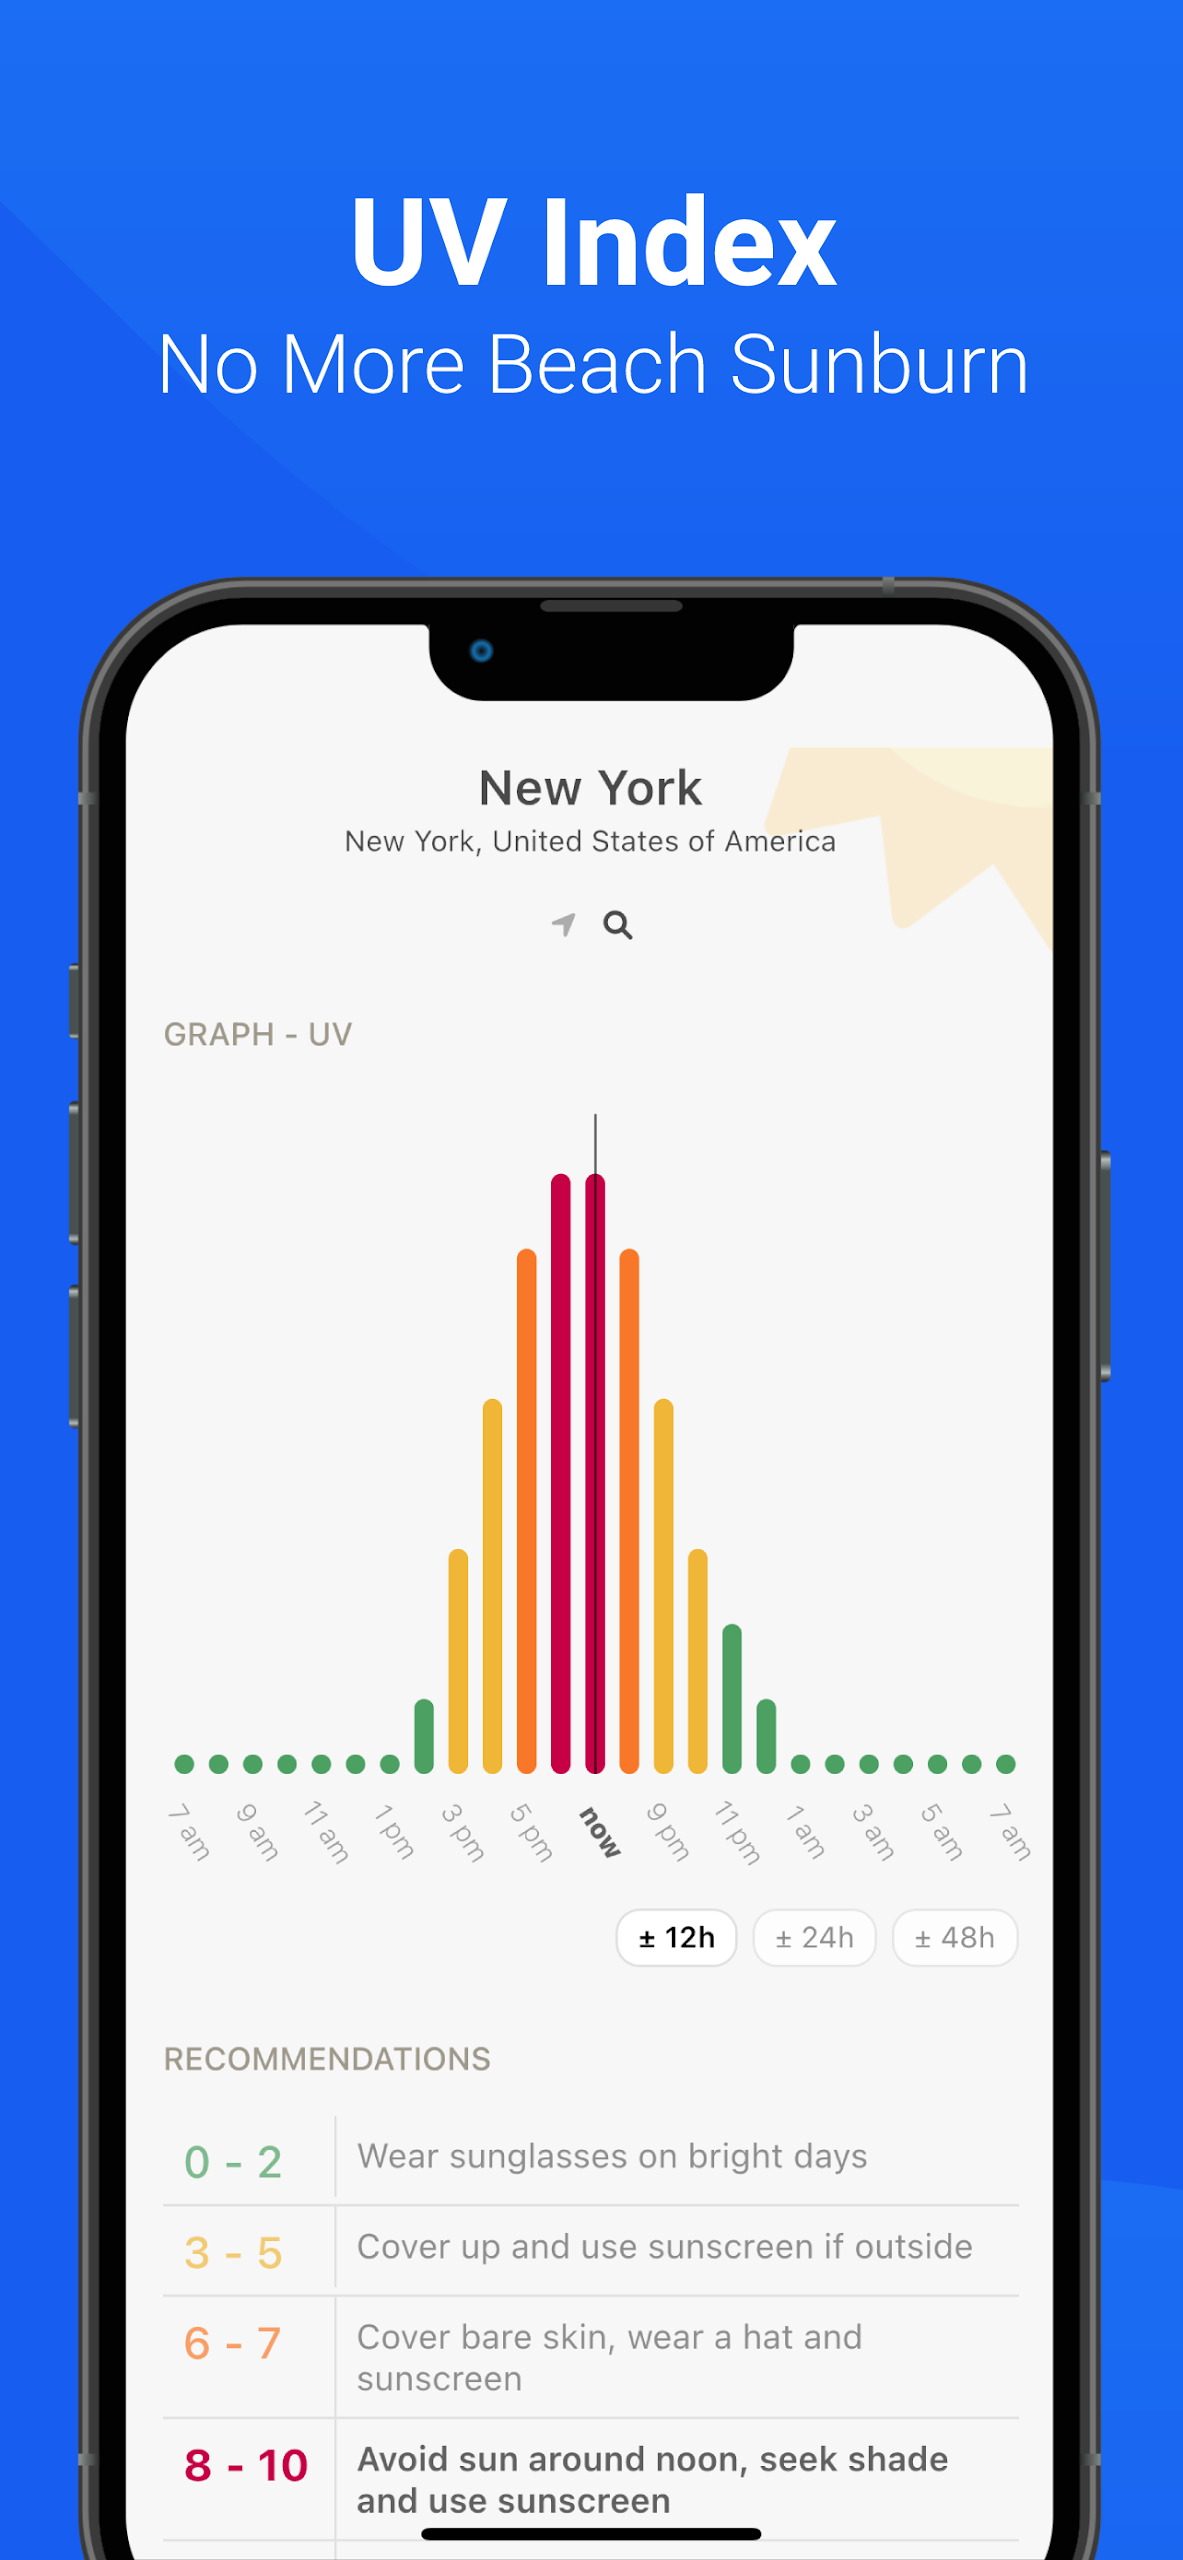
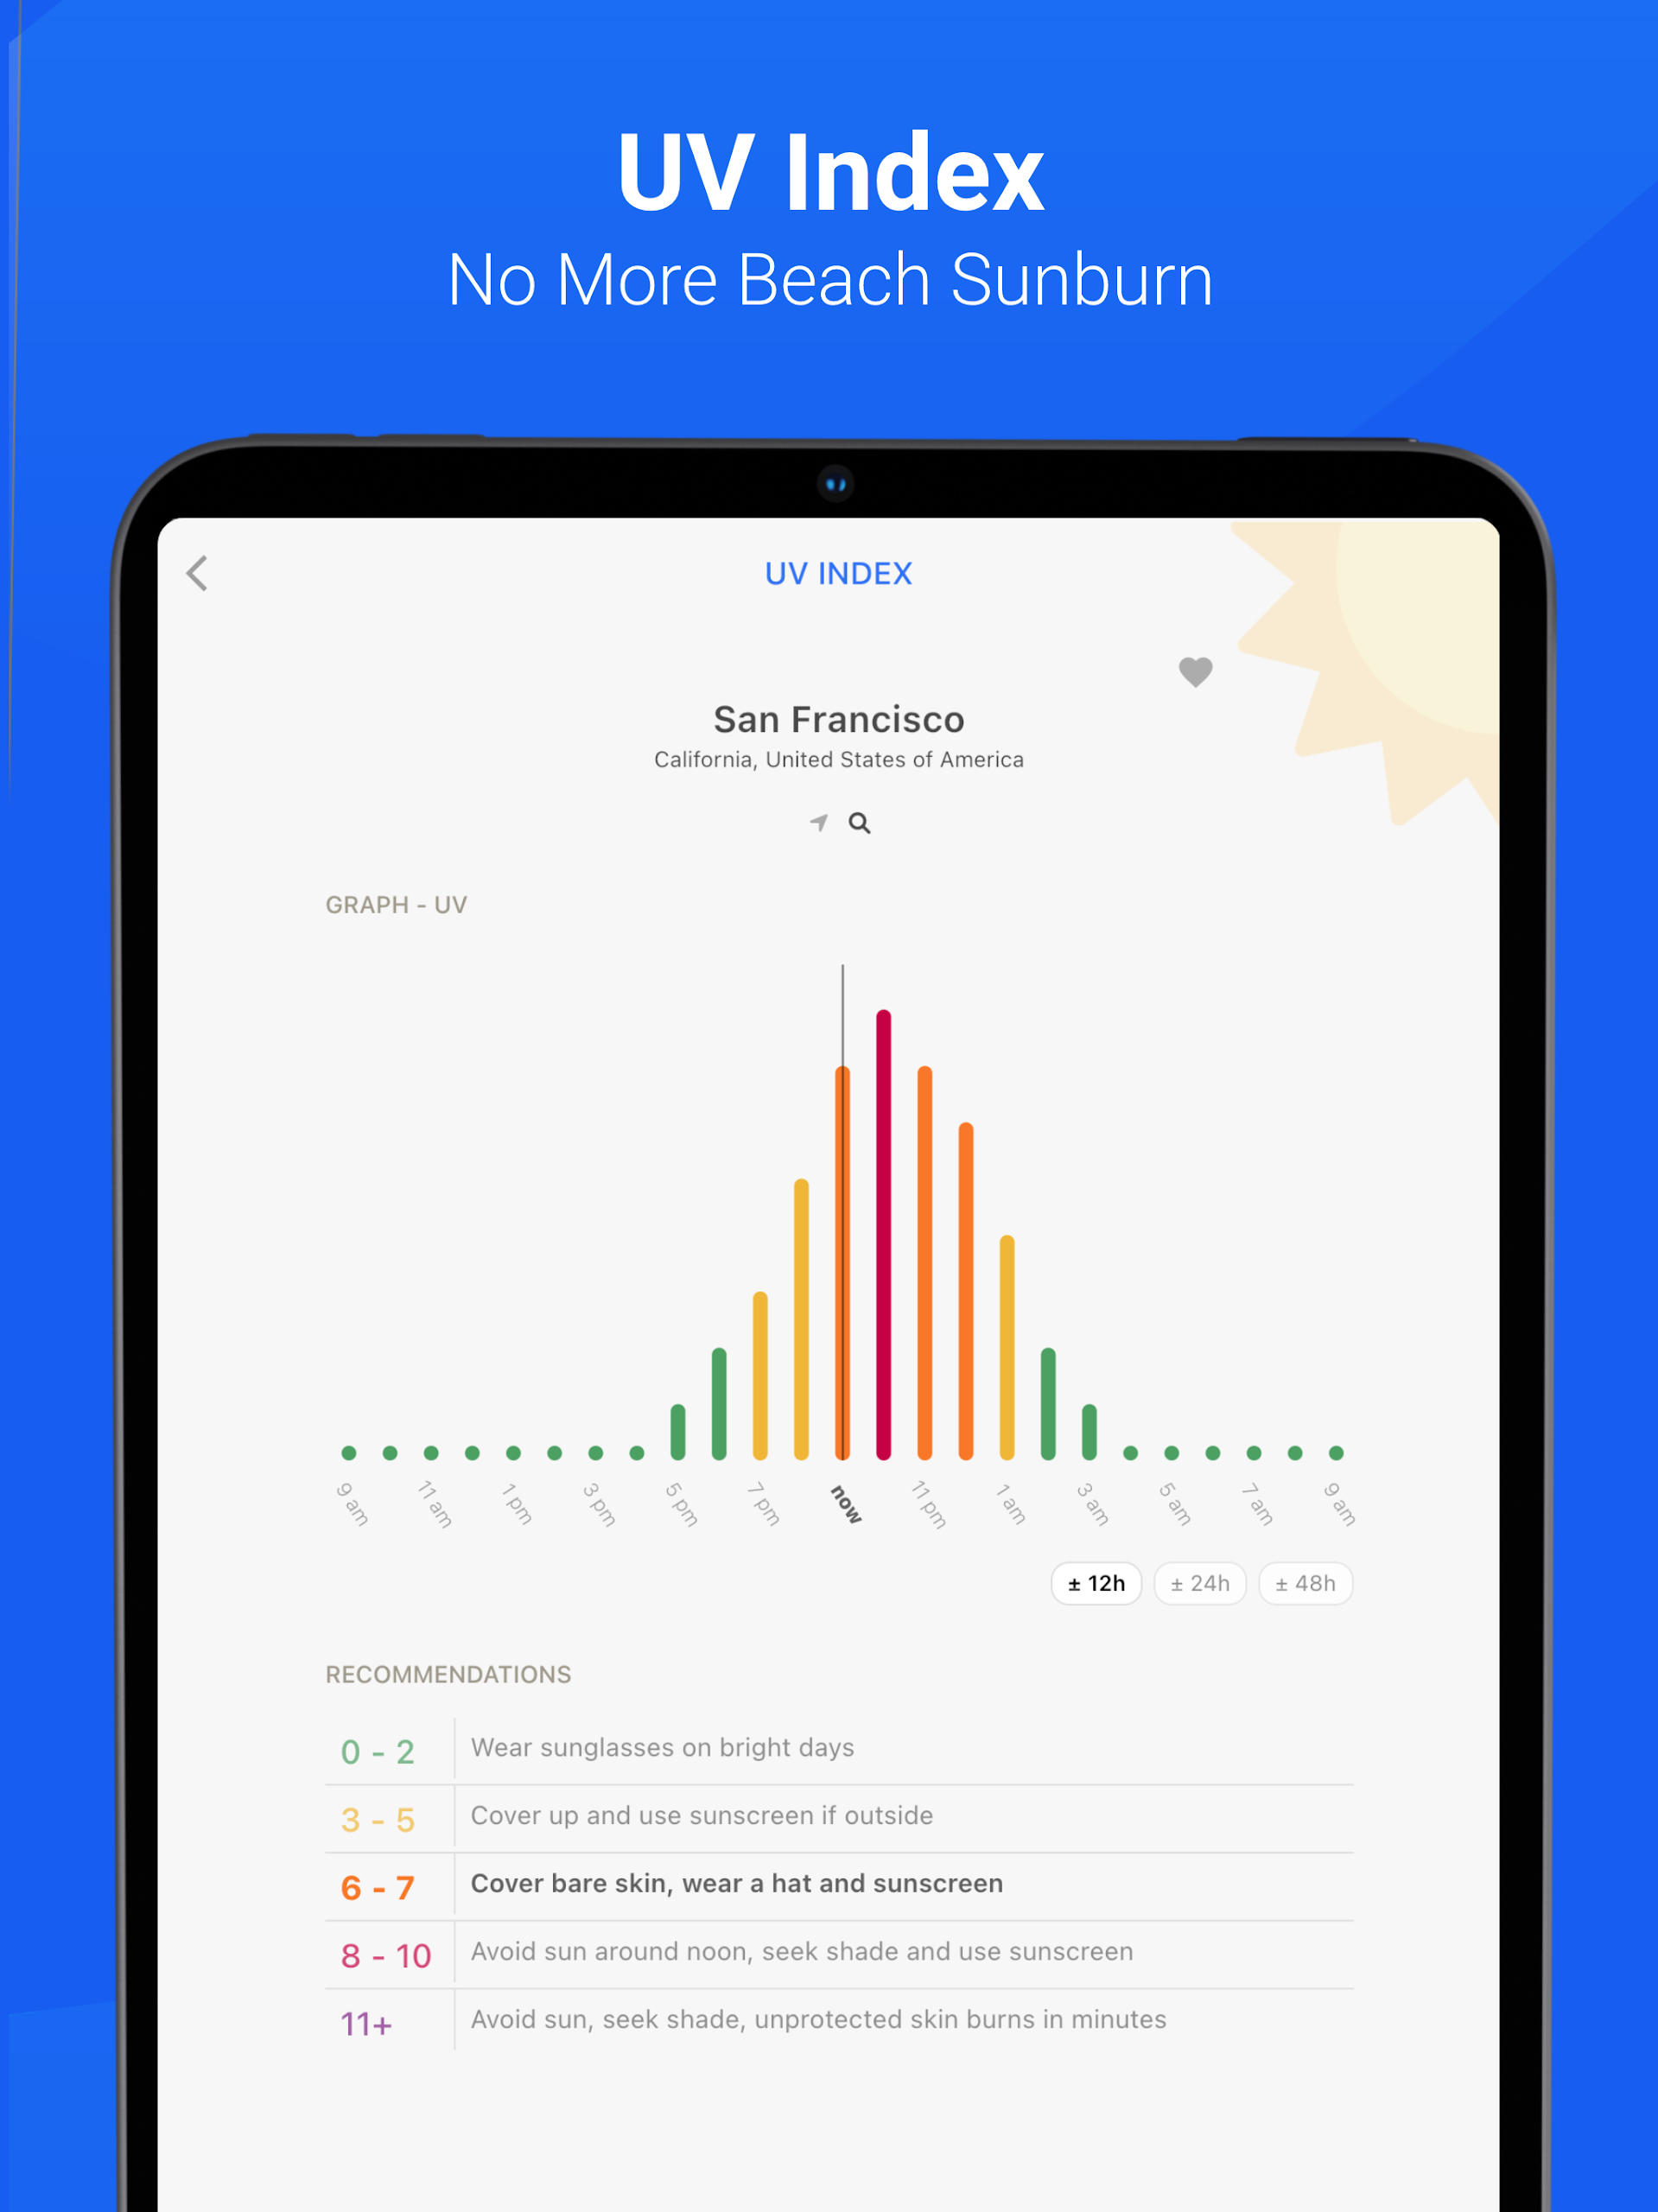
- UV Index Monitoring and Forecasts: Prevent sunburn while enjoying the beach by knowing when to find shade.
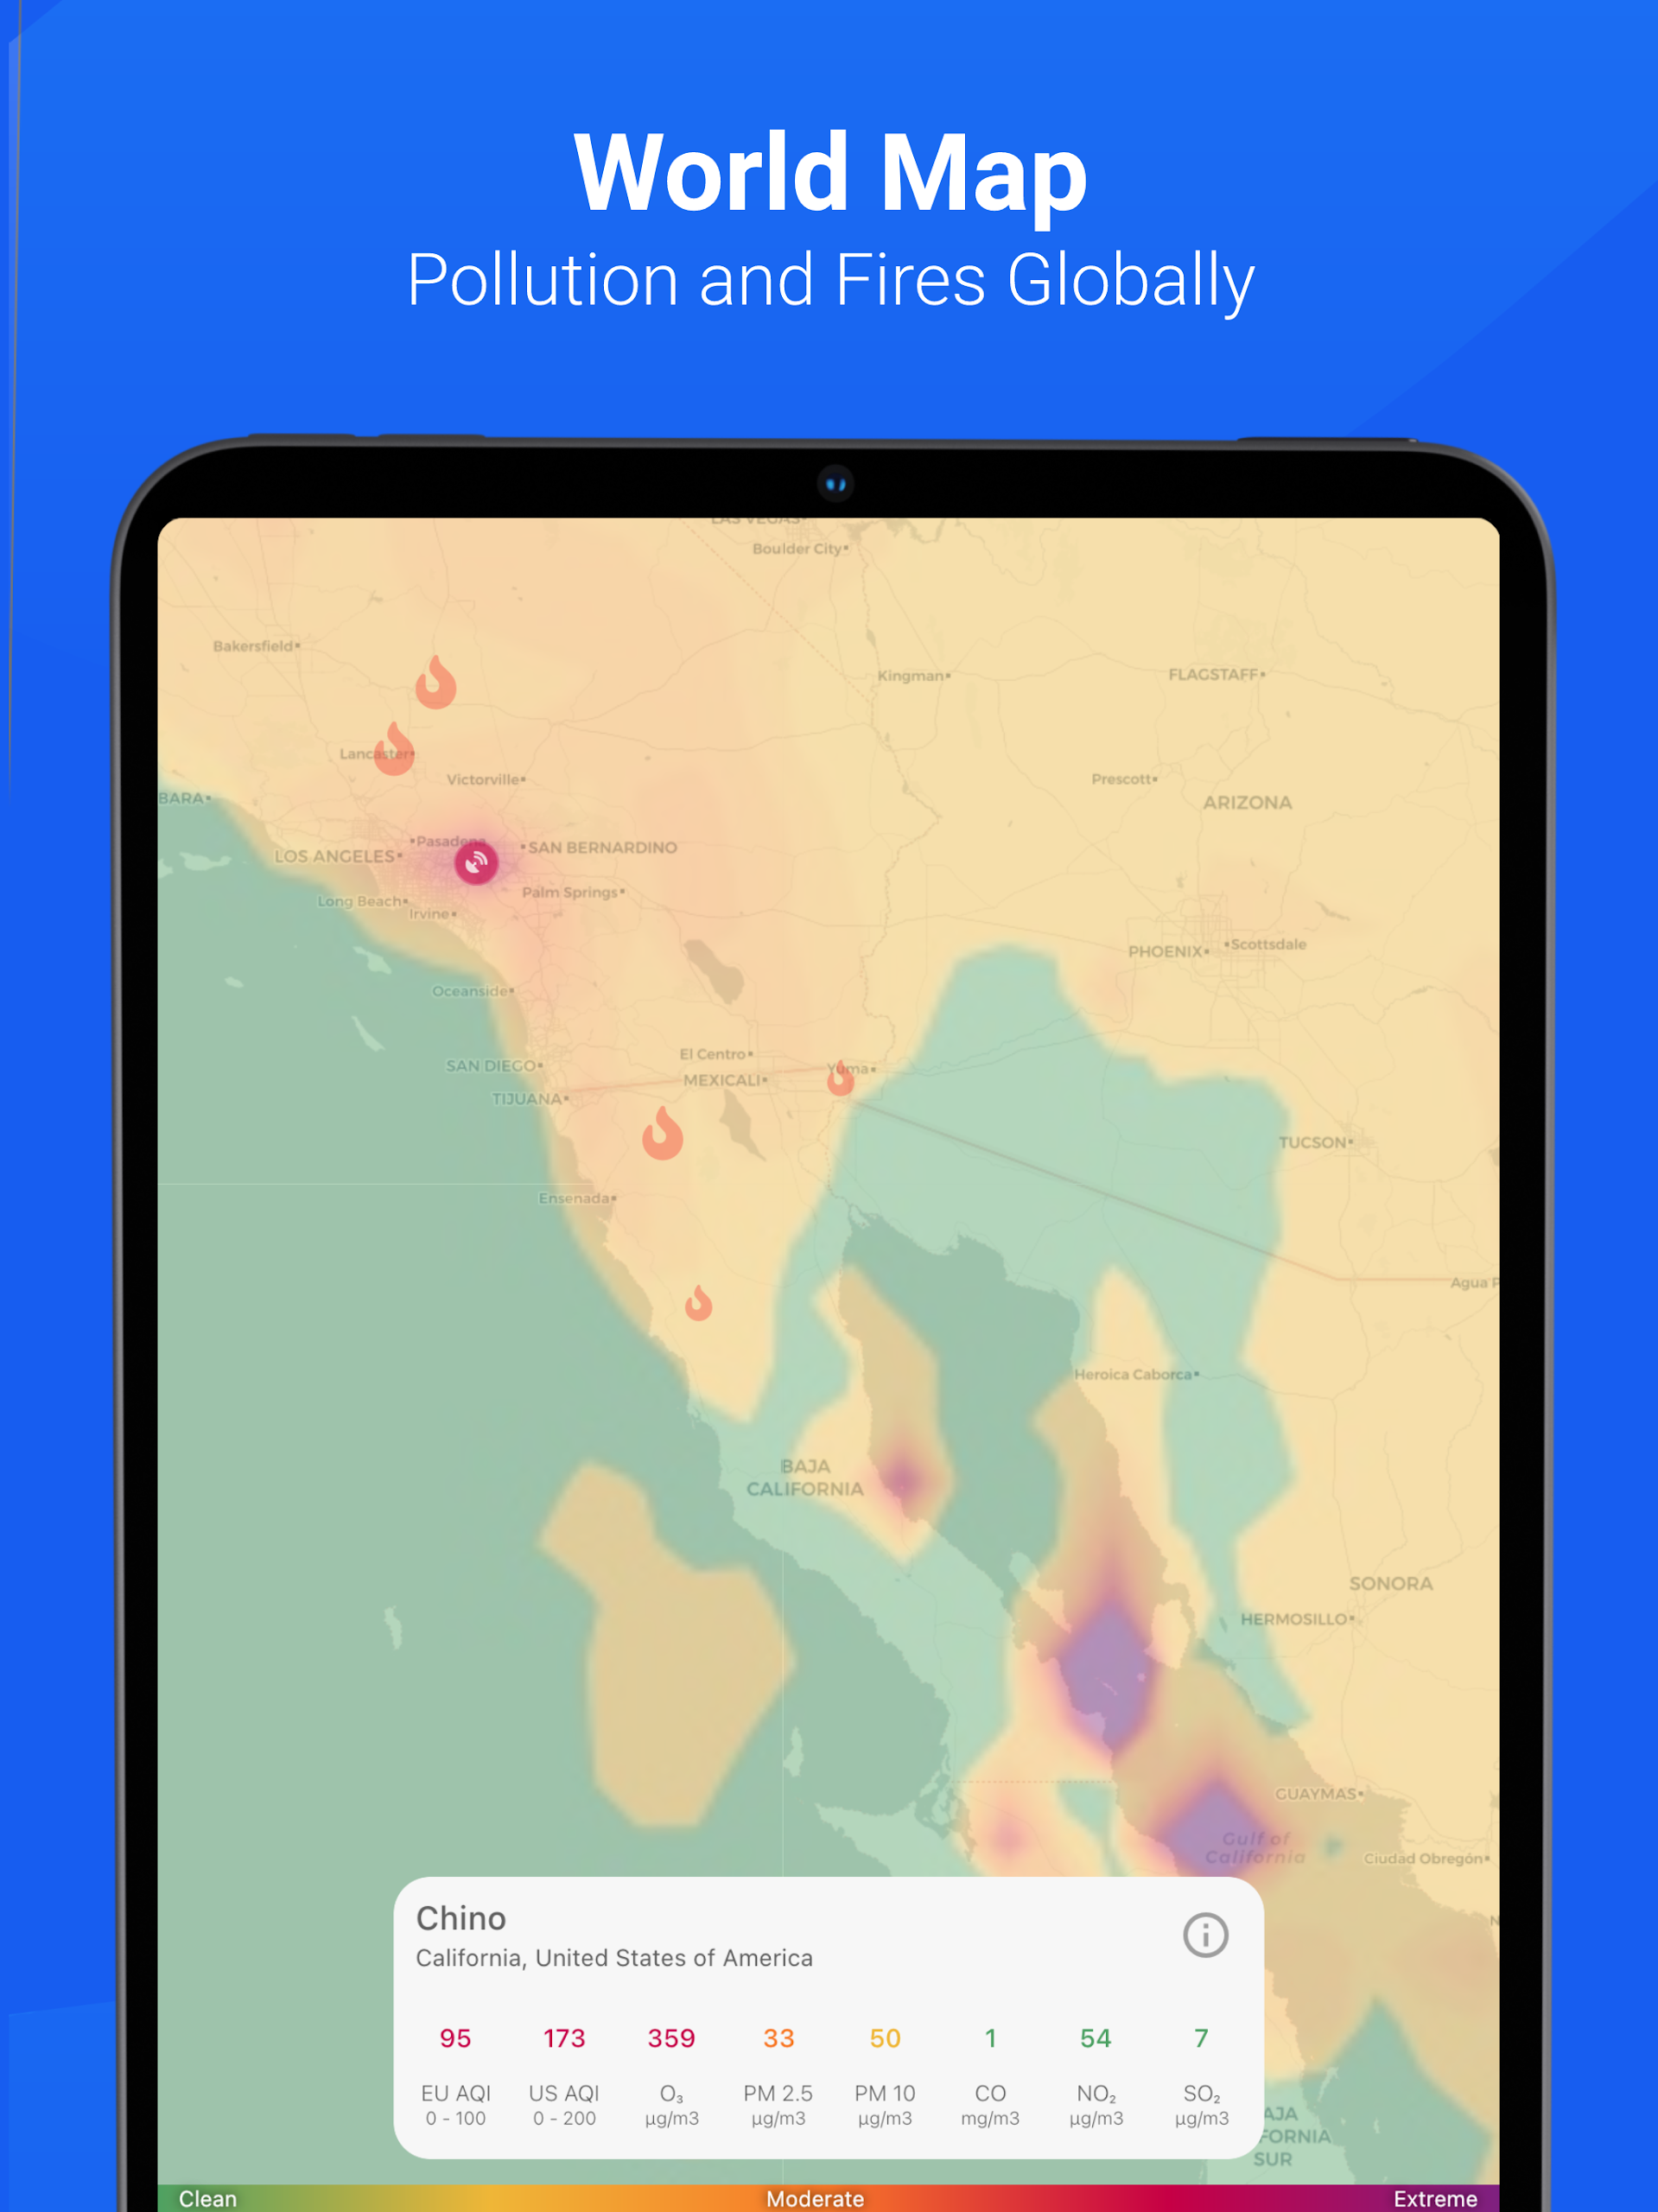
- Fire Hotspots: Discover areas where NASA satellites have detected wildfires.
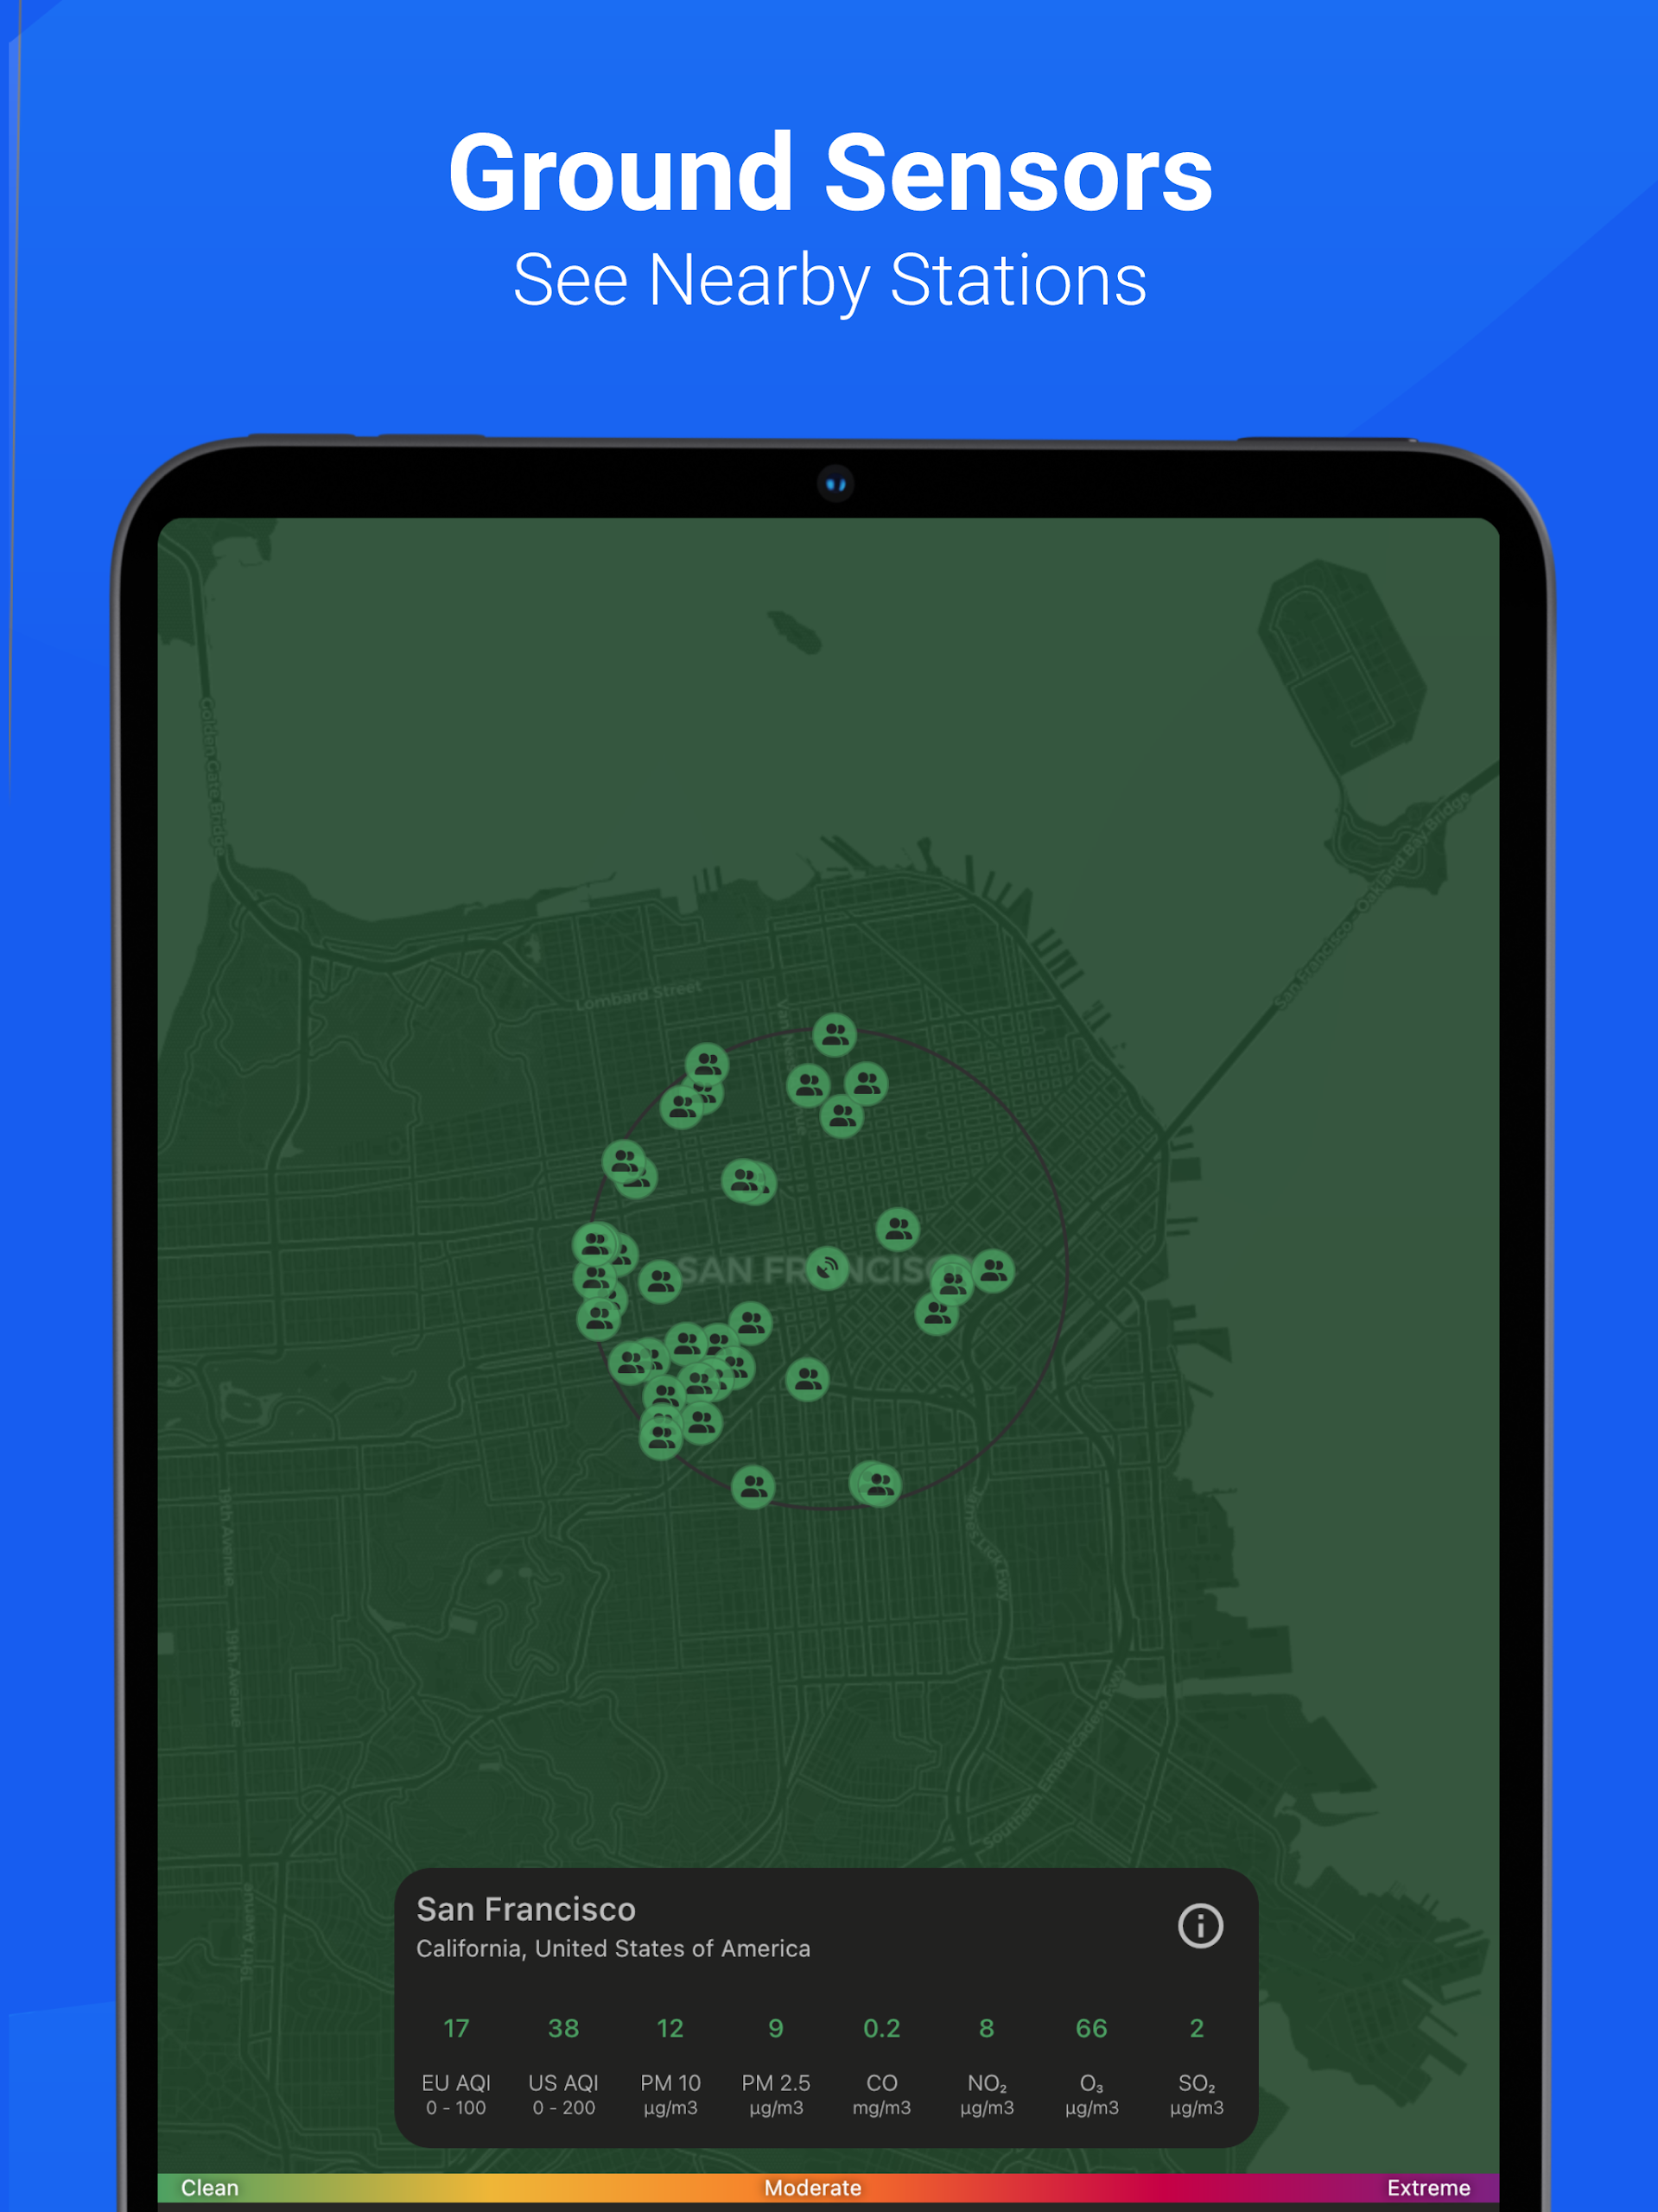
- Breakdown of Air Pollutants: Access detailed information about PM10, PM2.5, NO2, CO, SO2, and O3 present in the atmosphere.
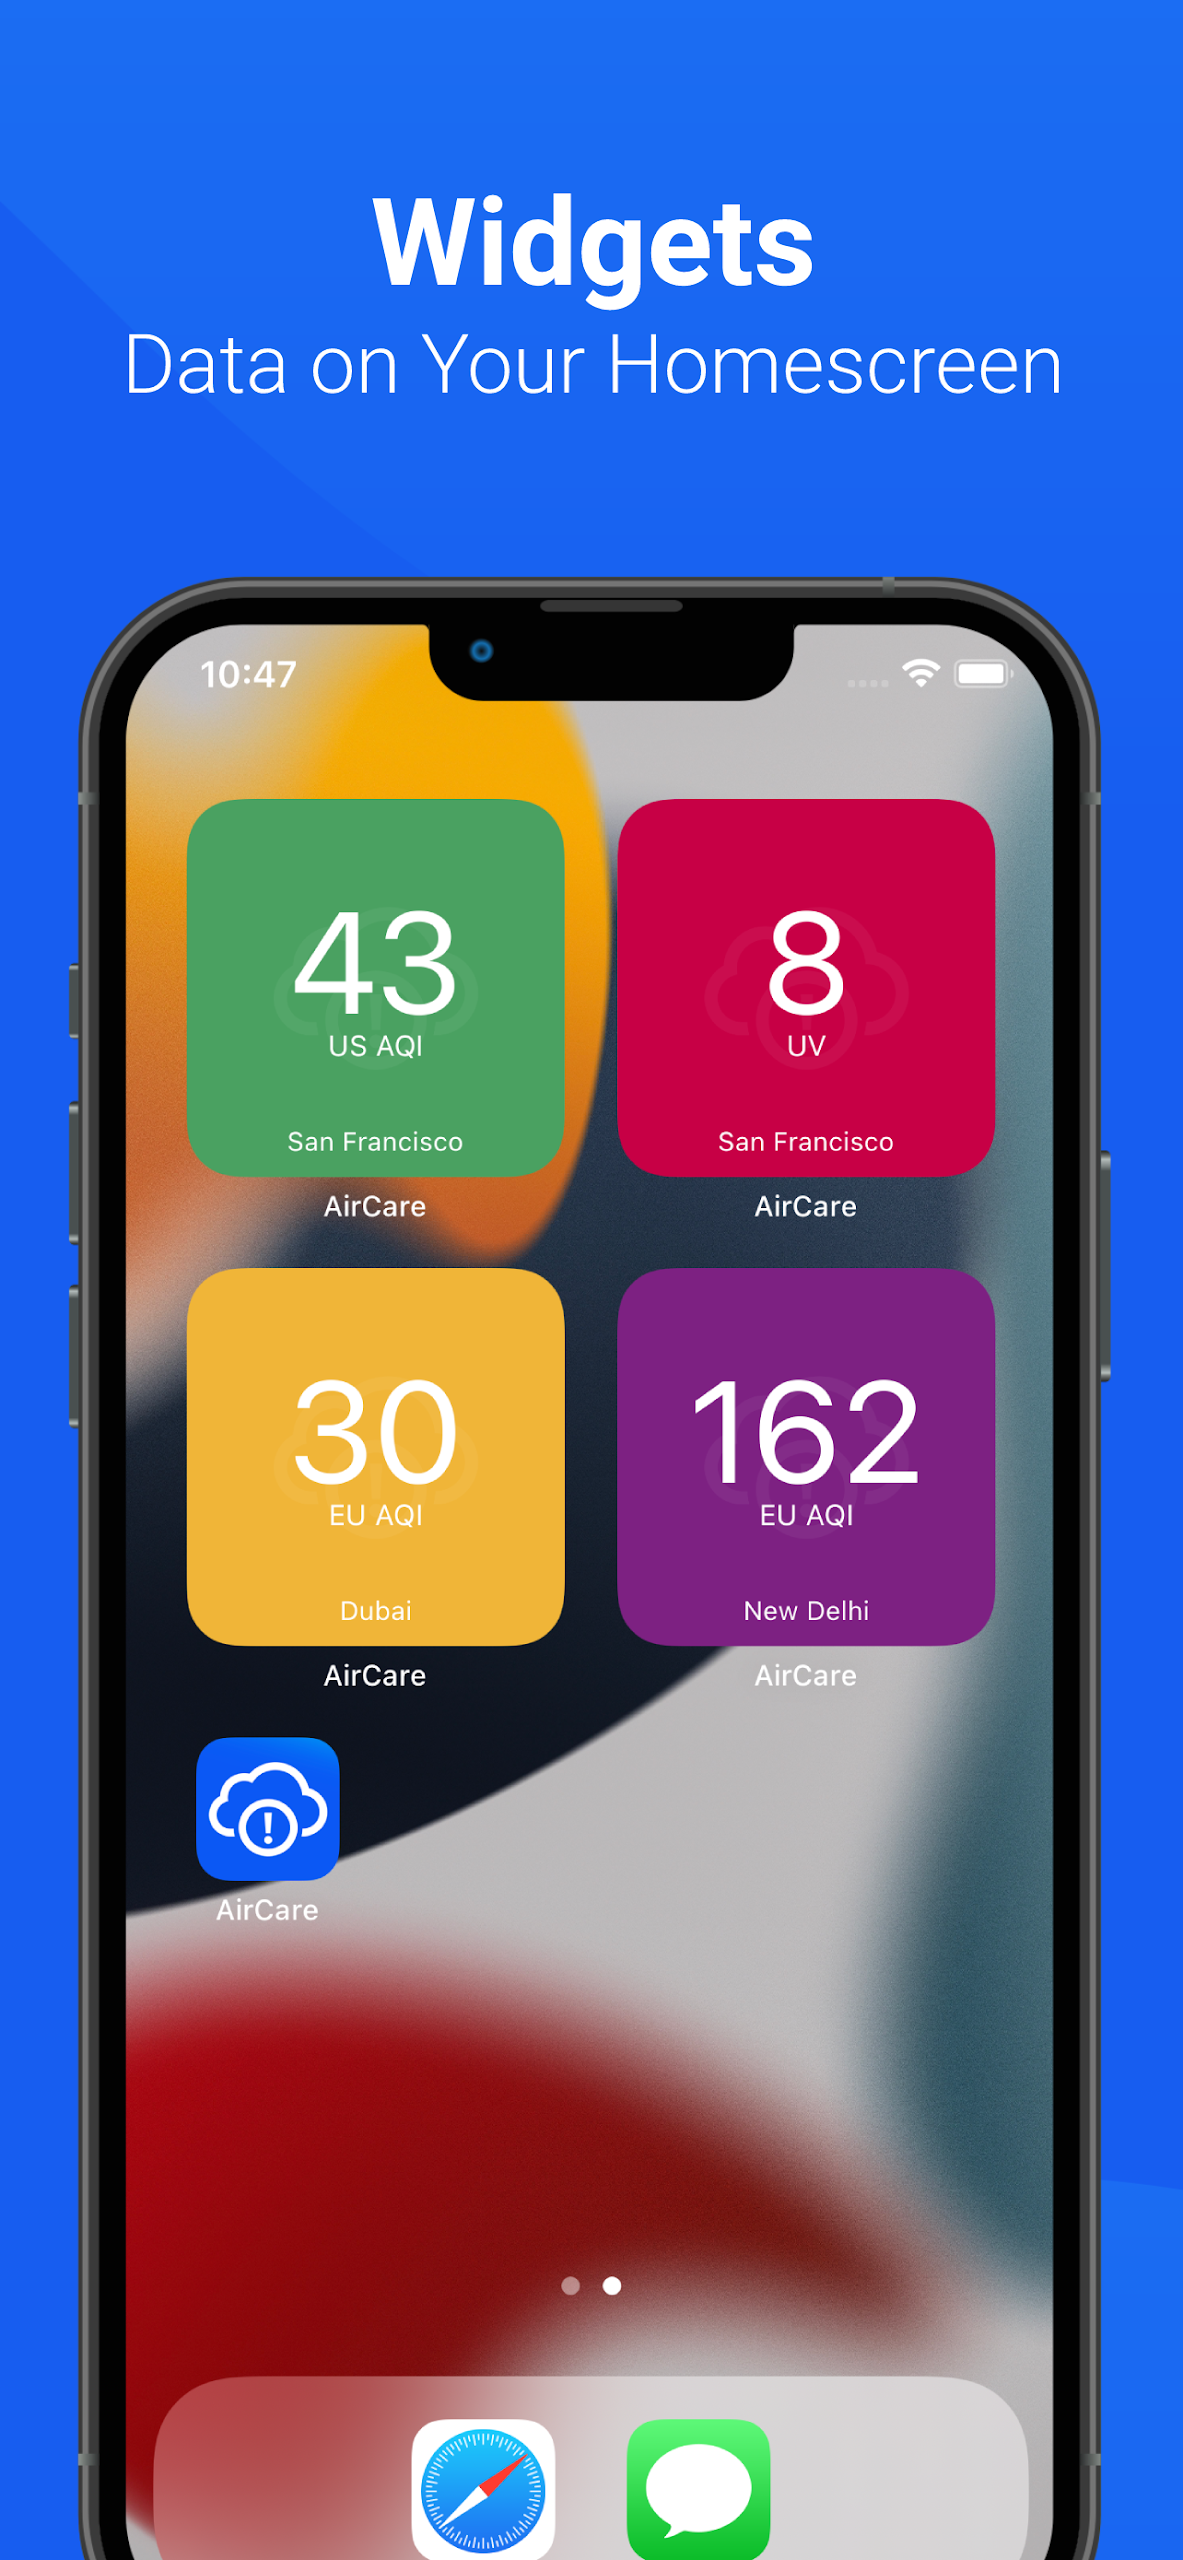
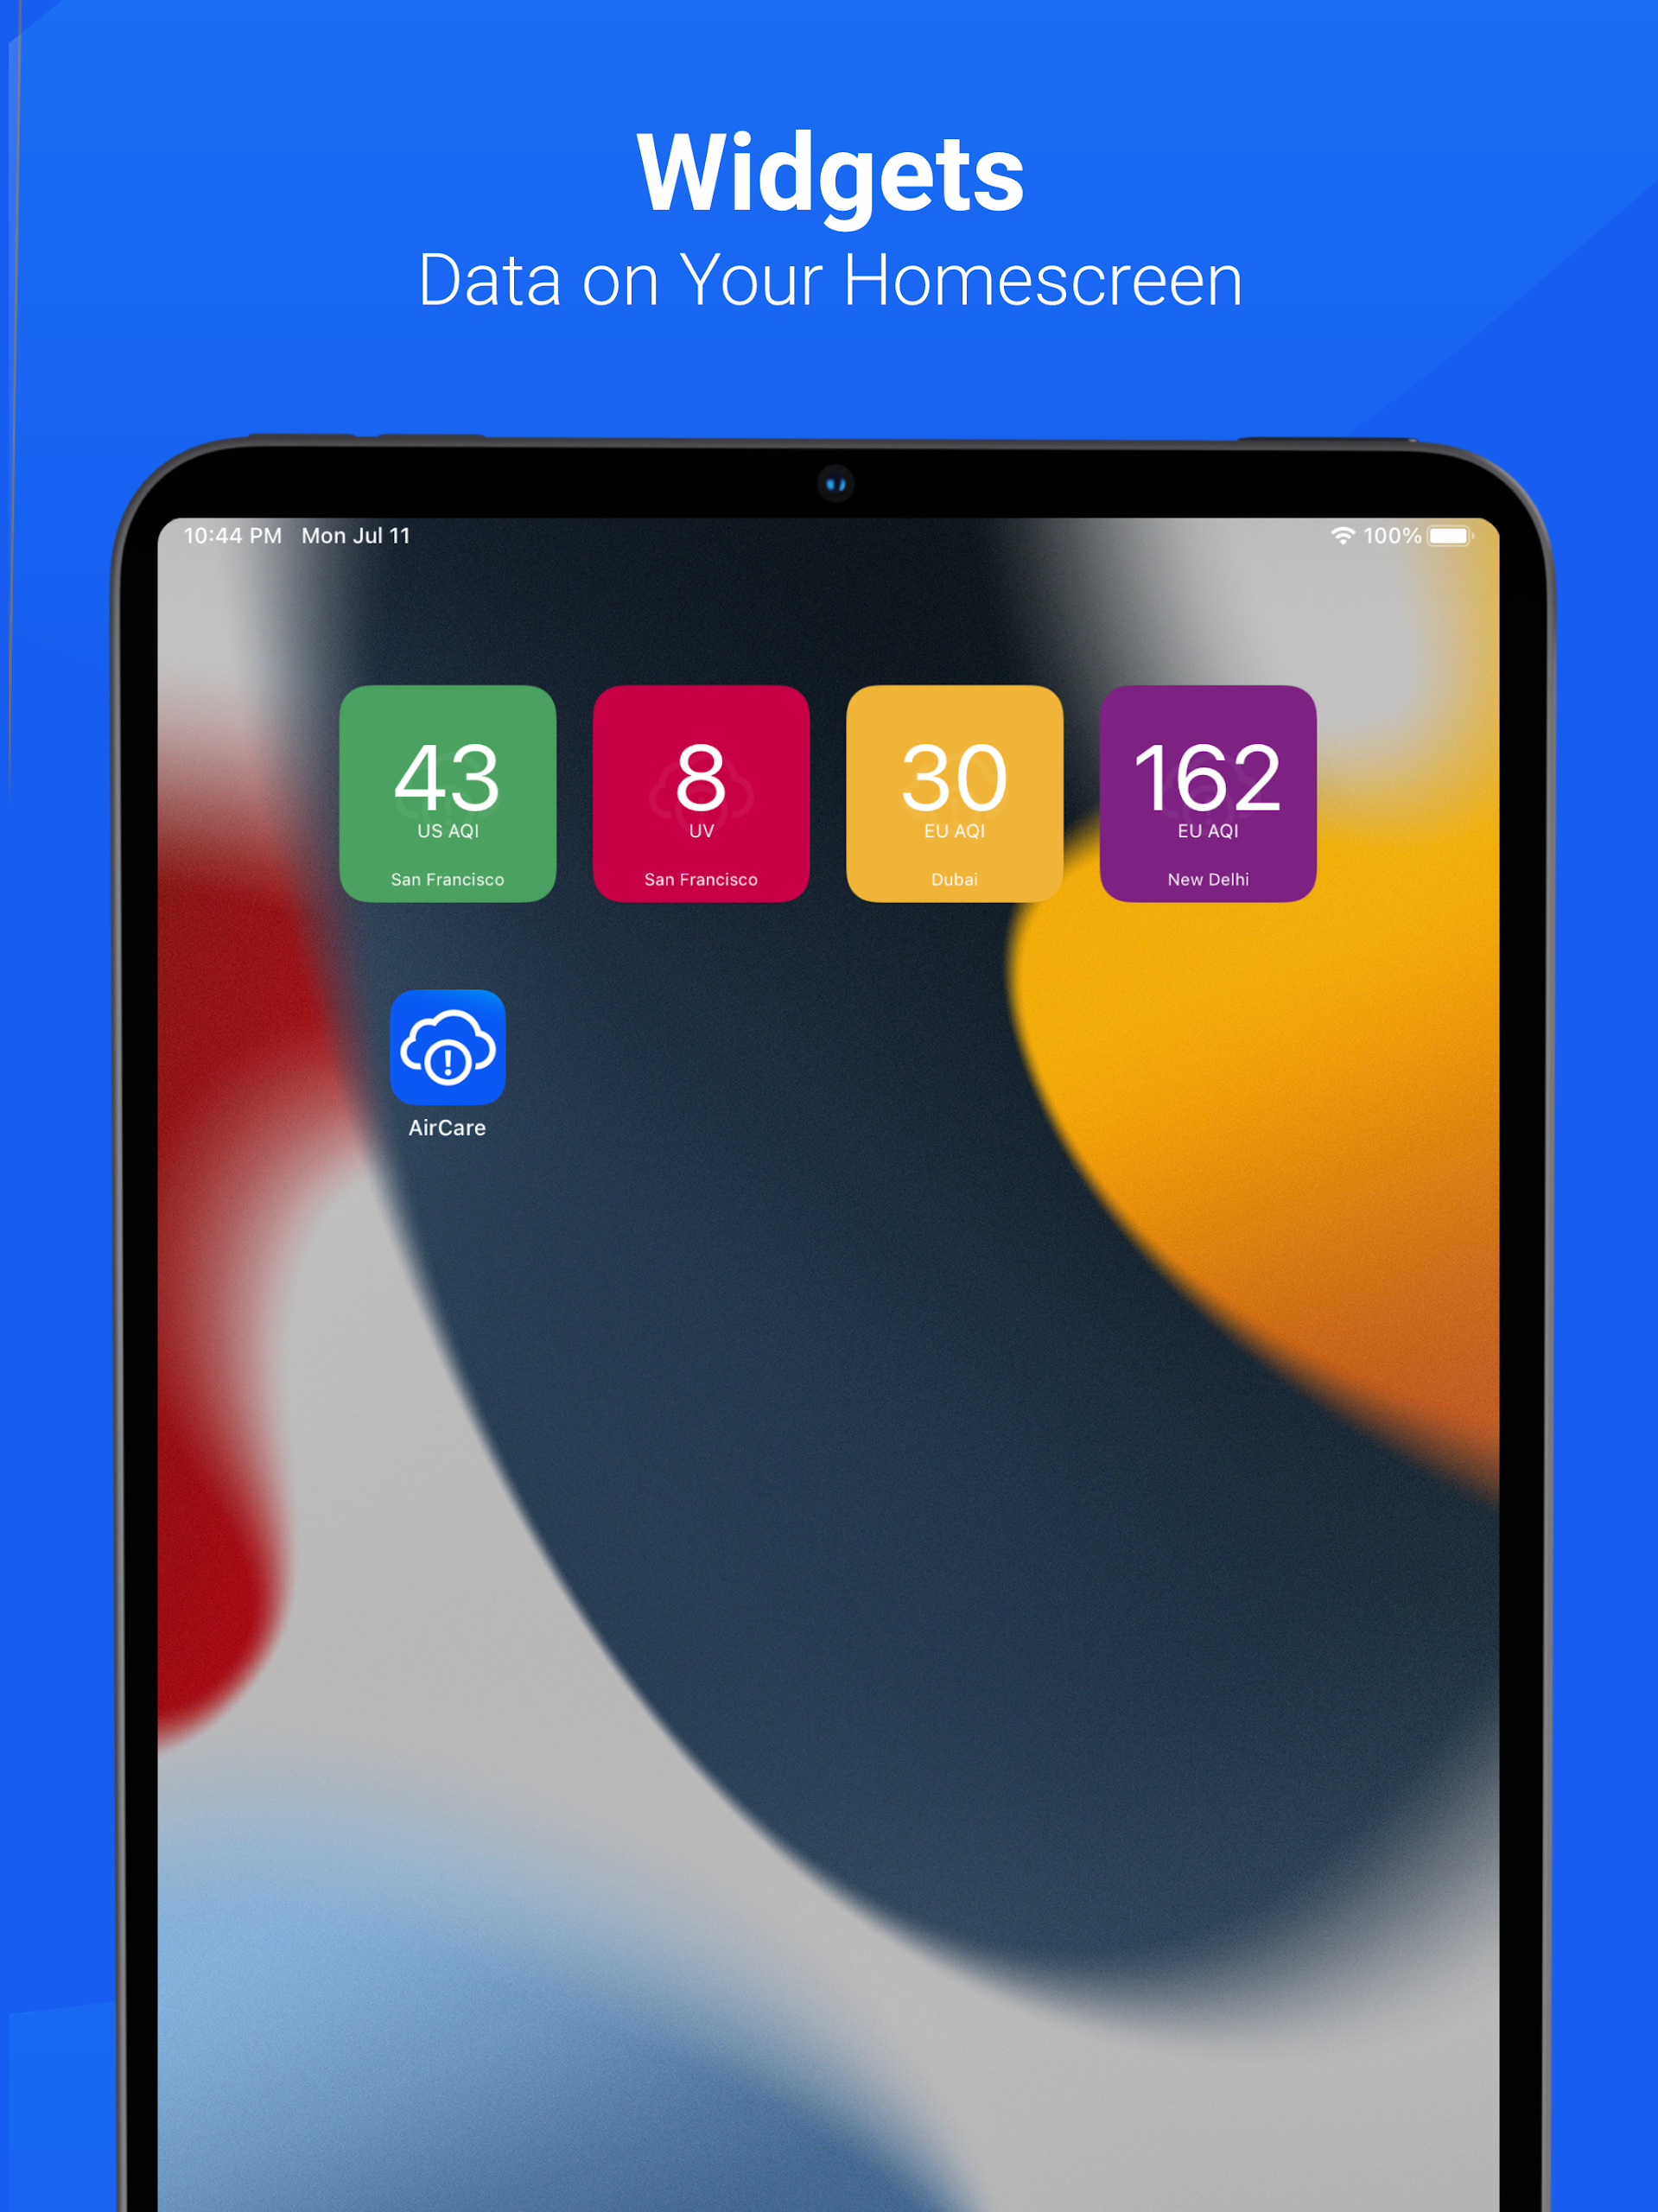
- Home Screen Widgets
- Push Notifications for Changes in Levels
- Apple Watch Compatibility
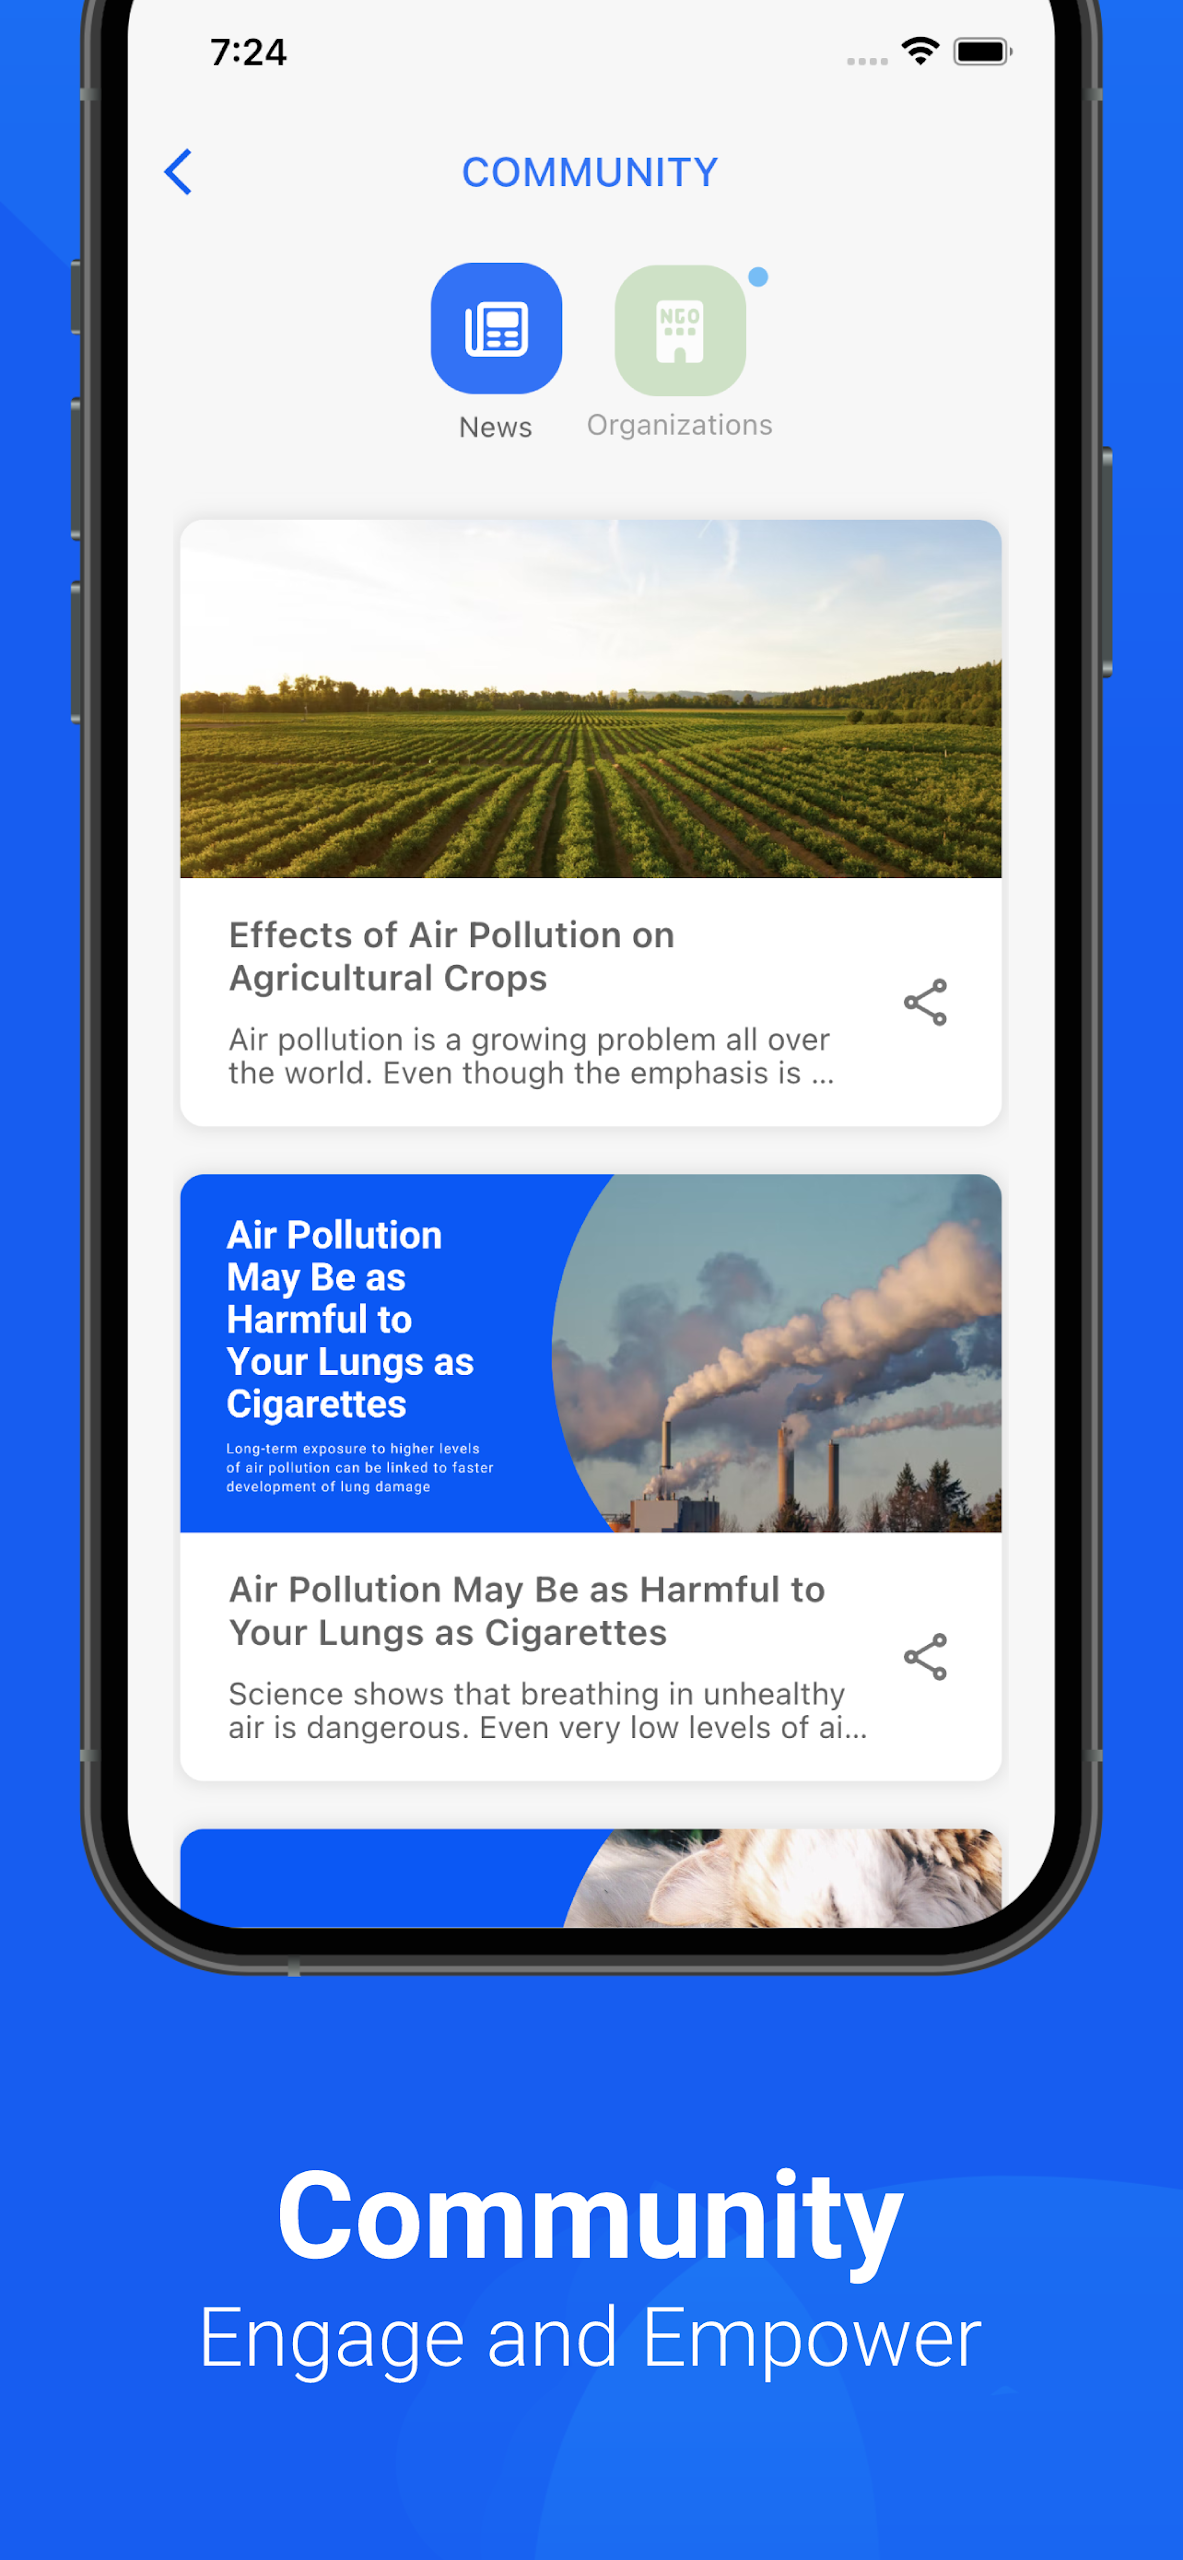
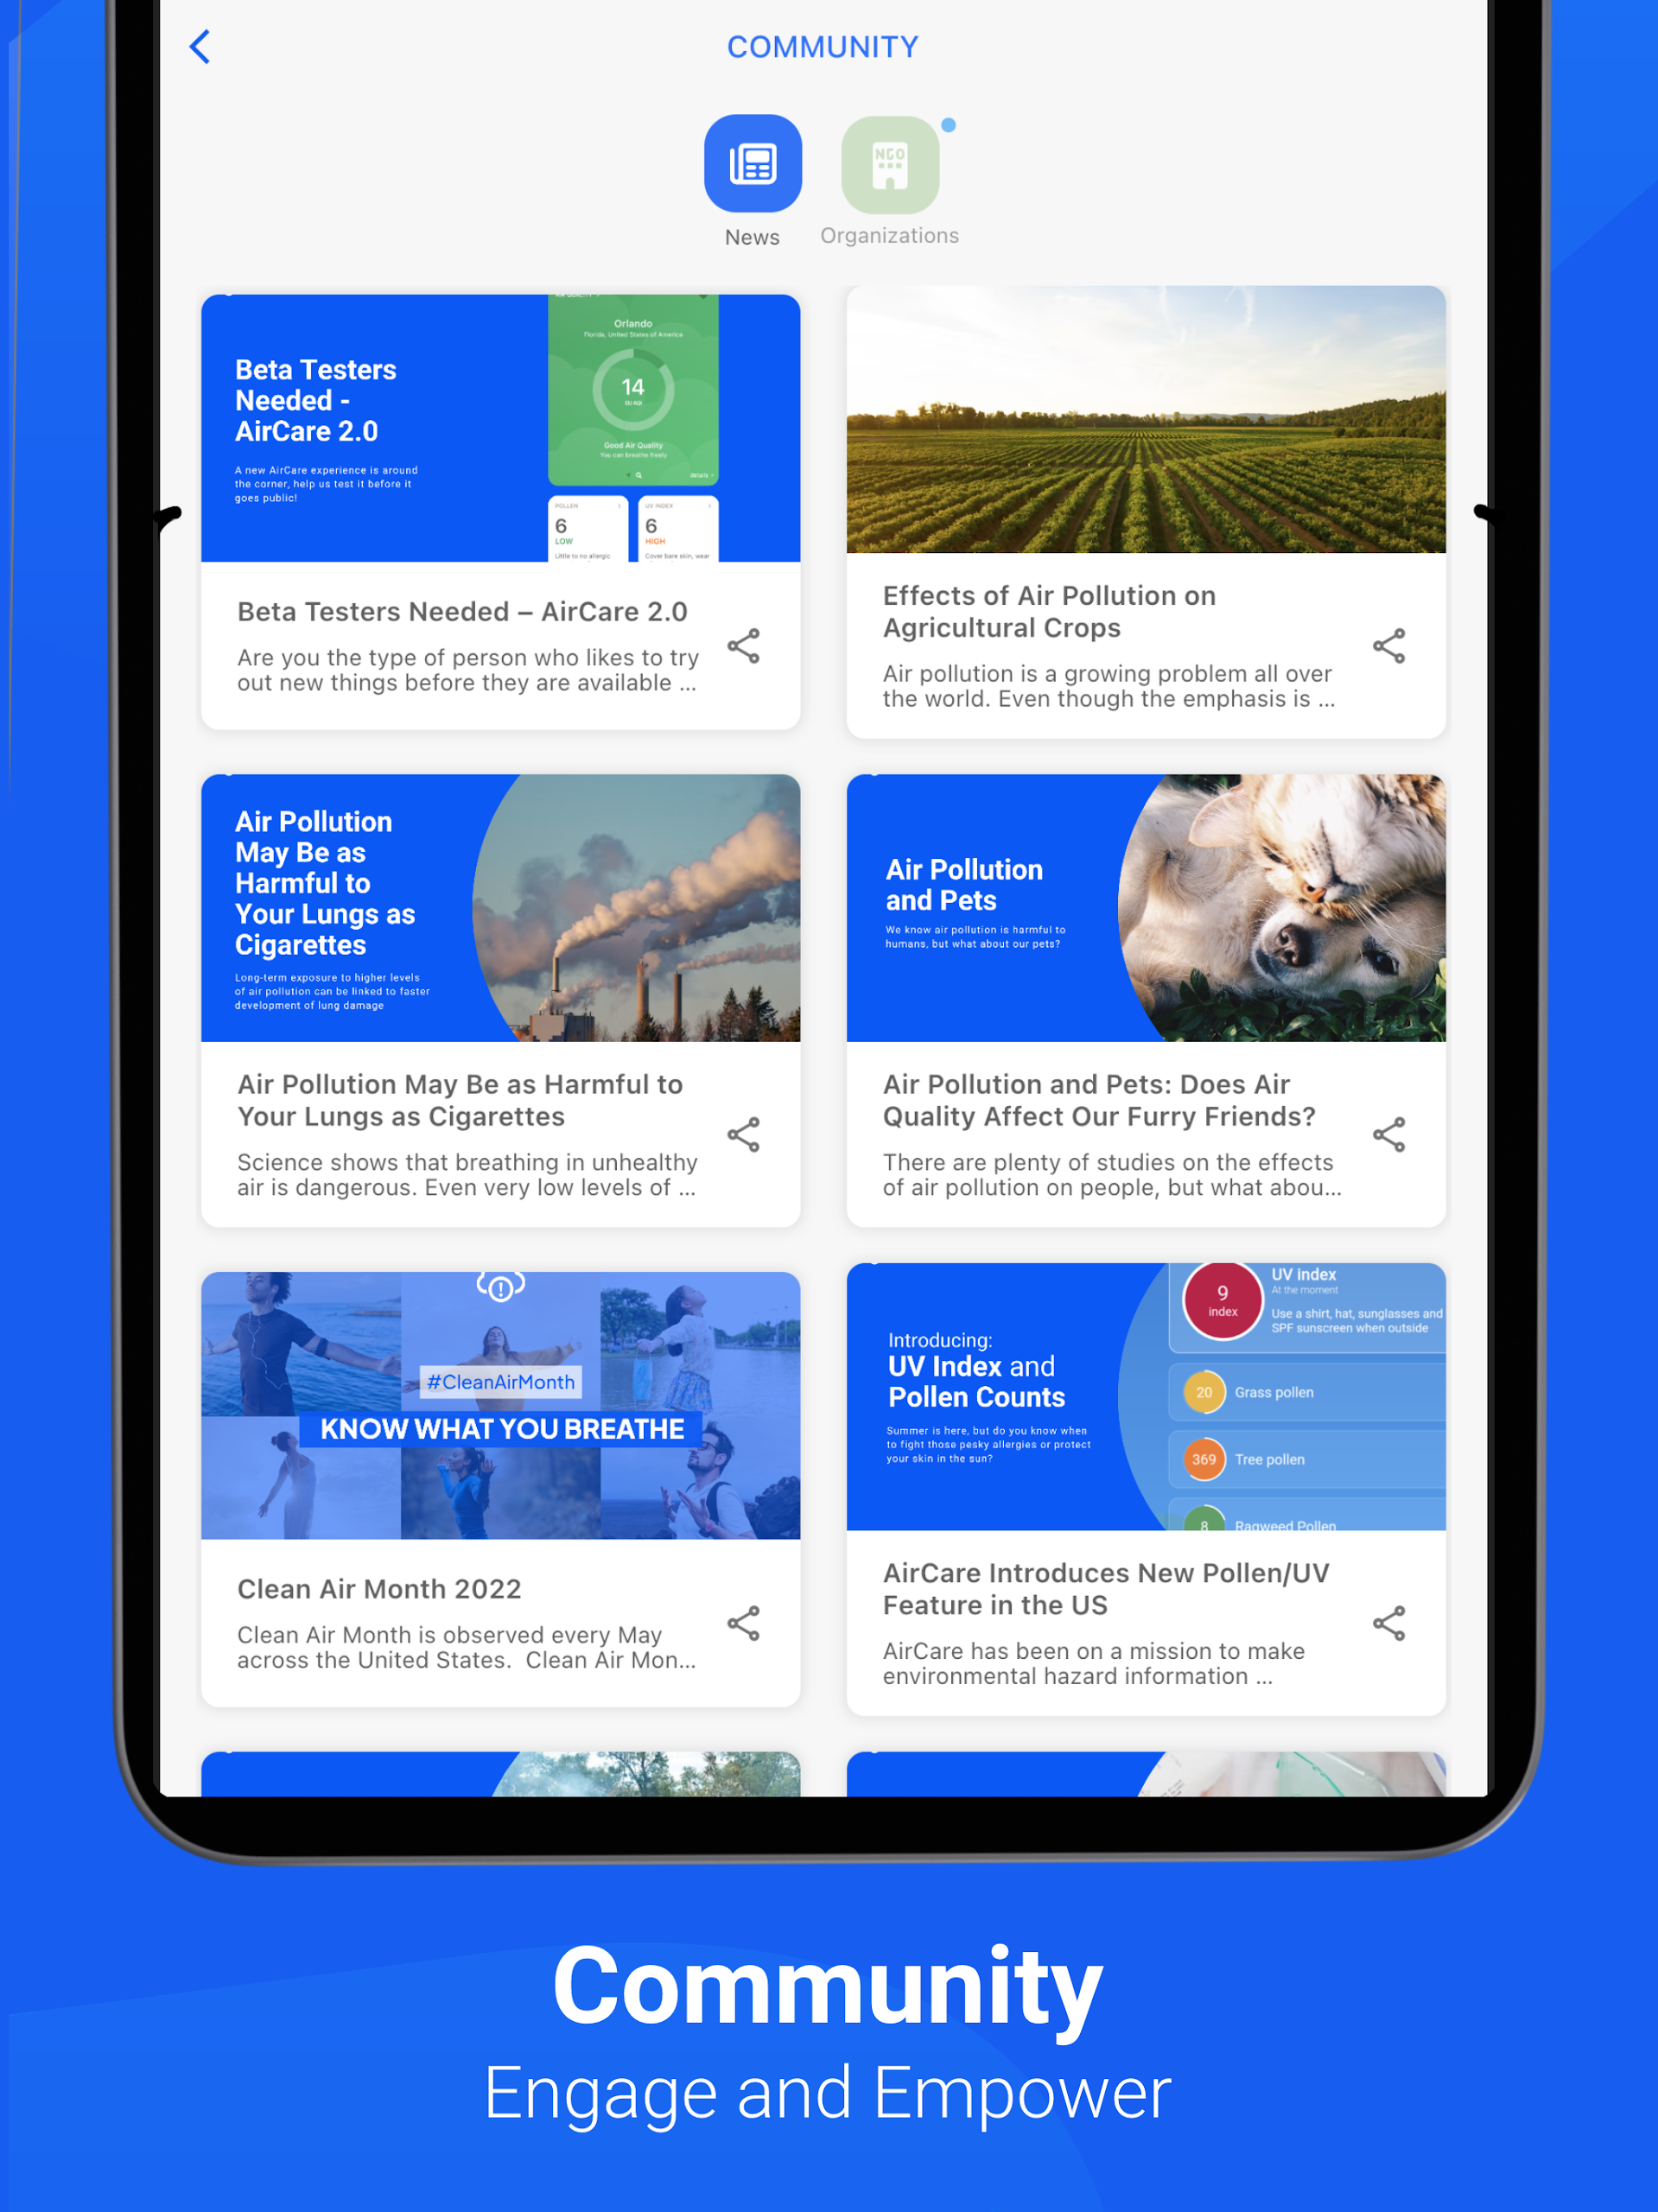
- Educational and Community Resources
Data Sources:
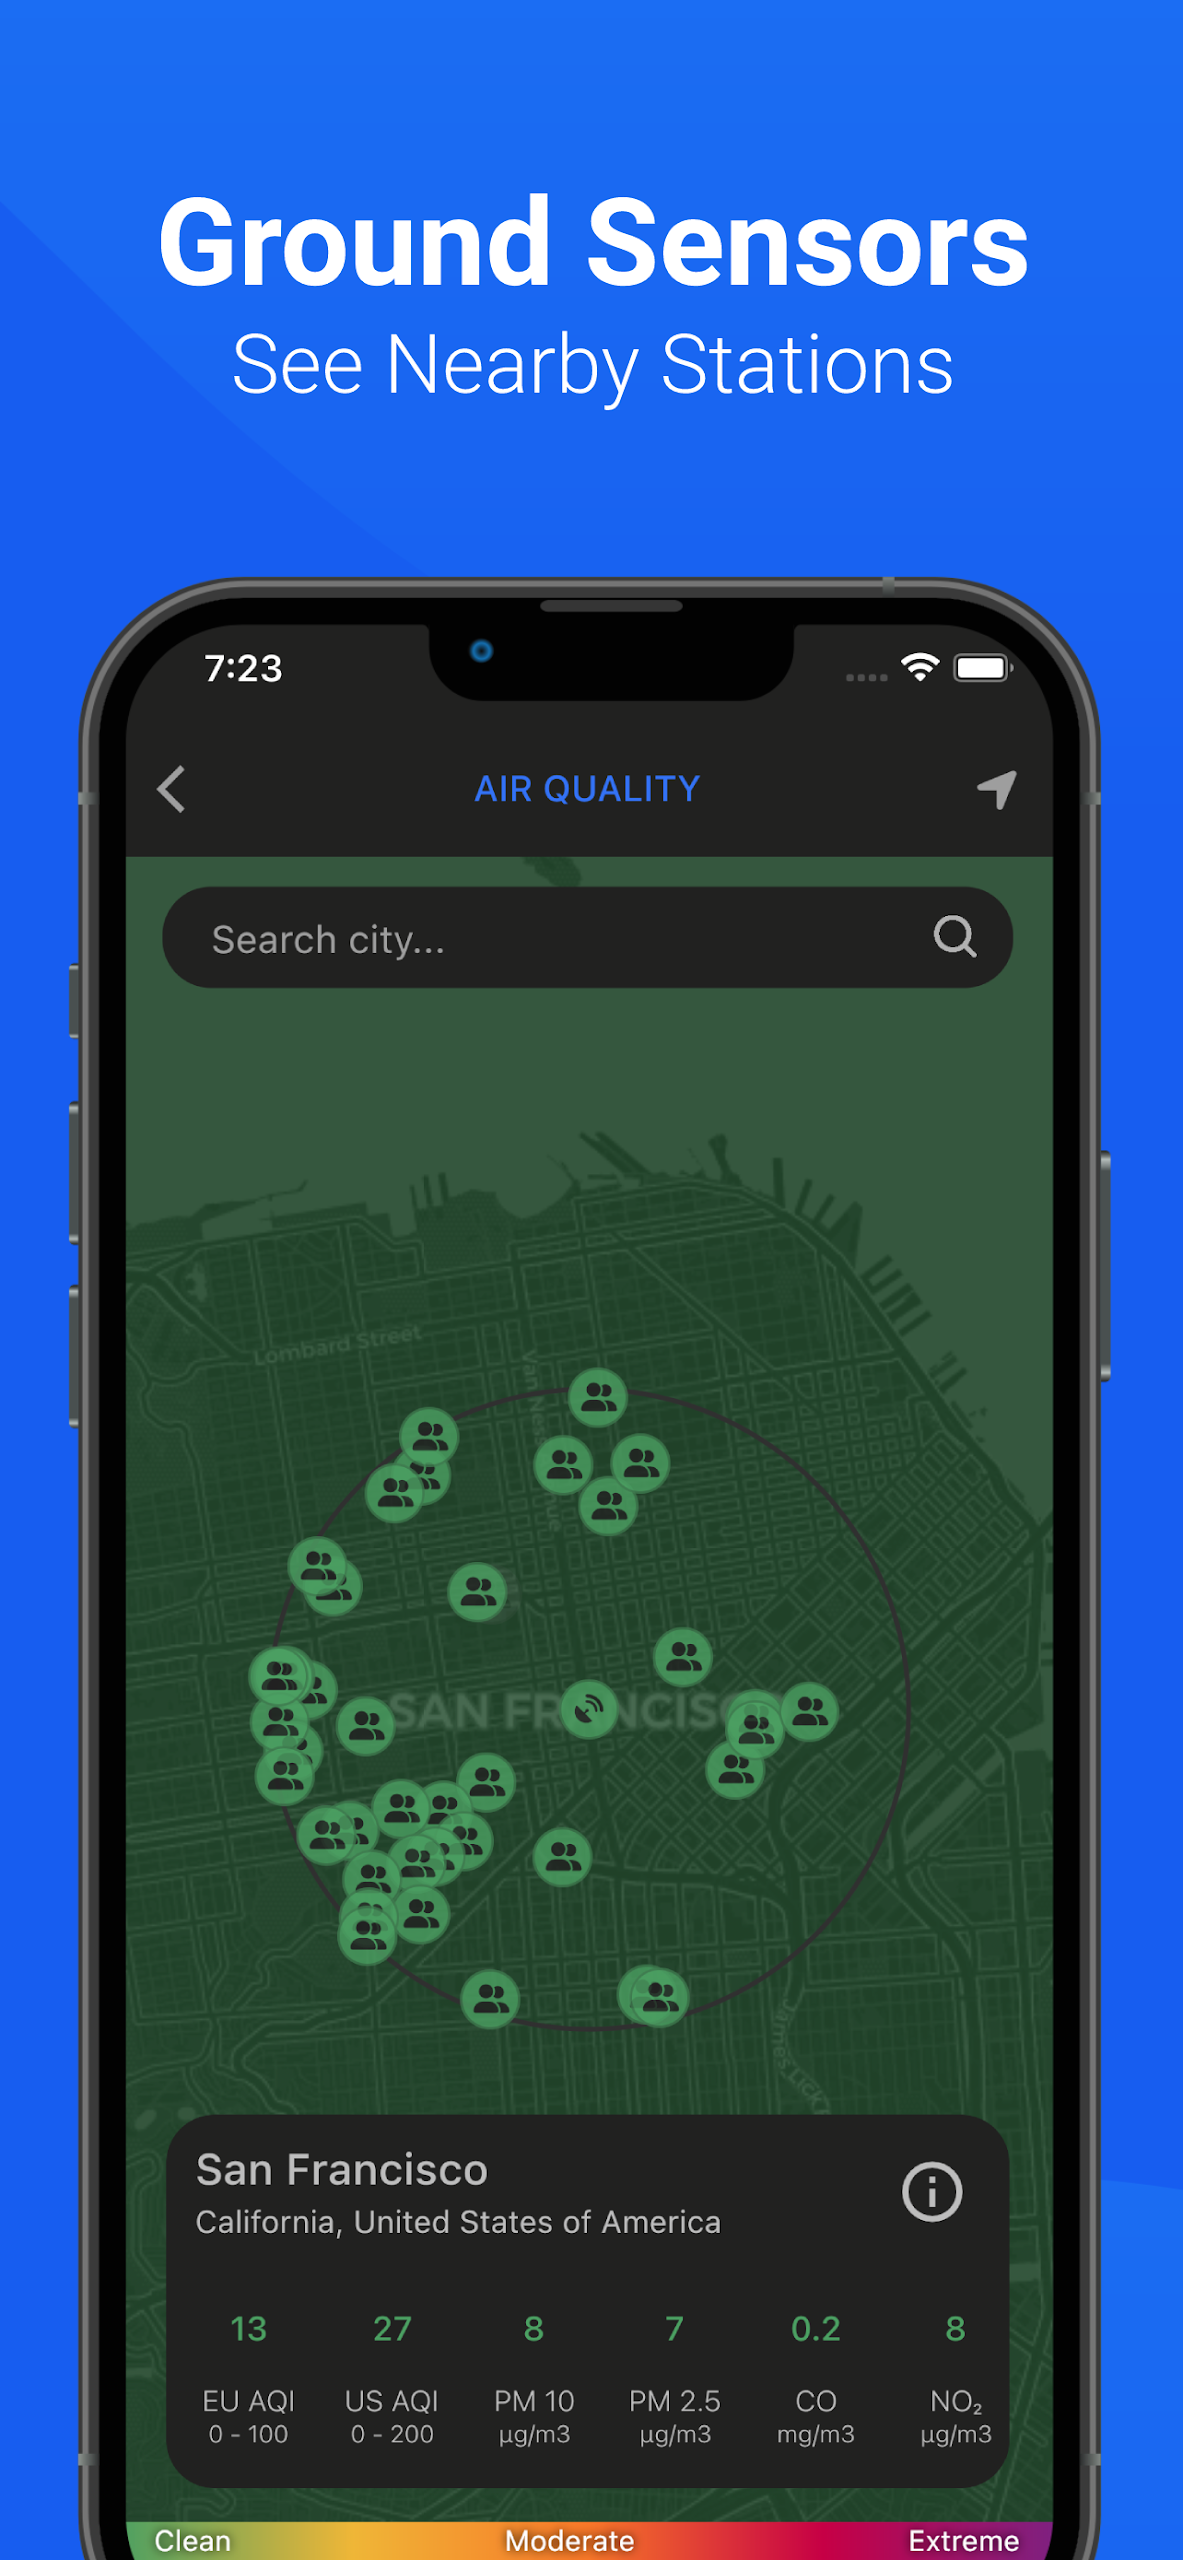
AirCare utilizes a combination of satellite data, ground observations, and weather stations to provide the most precise AQI for any location. Our data is sourced from:
- Purple Air
- Environmental Protection Agency (EPA)
- Sensor Community
- Over 40 additional sensors from government, academic, and volunteer sources
Download AirCare today and see why millions are using this app to stay informed about their air quality!
FAQ
What does AirCare do?
AirCare’s mission is to inform every citizen about the quality of air that they breathe, helping raise awareness and empower action!
What started as a local activist project in Macedonia in 2014, has grown to a worldwide community that empowers citizens to help not only spread awareness about air pollution, but also lobby for greener and cleaner policies!
Where do you get your data from?
AirCare is an aggregator of air quality data from many networks around the world, including government, volunteer, and satellite ones. We take all of this raw data and transform it into an AQI number via our intelligent algorithms. On the details page for every location, you can see the sources used for that location in order to calculate the AQI.
What does the Pollen/UV feature offer to users?
With our pollen/UV feature for US users, users can monitor 3 types of pollen, including grass, ragweed, and tree pollen, as well as real-time UV index.
How does AirCare ensure accuracy?
We don't rely on just one measurement to calculate an AQI. AirCare uses a range of available data from stations belonging to governments and institutions, volunteers, universities, as well as satellite data from the European Space Agency. We run all of that data through our intelligent algorithm to give you a final AQI that is as accurate as possible.
Why does the AQI on AirCare not match with the EPA/PurpleAir one?
2 reasons:
AirCare uses more data sources than just one station. This way we ensure that even if a station is malfunctioning, we can have others to correct it.
AQI on AirCare is calculated for measurements of the last hour, so it changes every hour. PurpleAir has multiple variations, the default one being a 15-minute AQI, while EPA calculates a 24-hour AQI. That is why you see variations in the AQI numbers.
We believe that a 1-hour AQI is the optimum because it lessens the chance of error peaks that may occur on small intervals (like 15 min), but also is much more relevant than longer intervals (like 24 hours).
What are the limits for each pollutant?
See the US AQI limits here and the EU AQI limits here.
Is there a difference between sensors?
Yes, not all sensors are created equally. Government ones are much more precise, but also rare and quite expensive. The volunteer ones are cheaper but not as precise for scientific use, they are great for knowing if there is low or high pollution in a certain area.
I want a measuring station in my area, can you add it?
Unfortunately, we at AirCare do not set up the measuring stations ourselves. We use open data from existing government and volunteer stations and display that in the app.
If you wish to have a sensor in your city/area, please read here as to how you can set up your own via the PurpleAir network.
Why doesn’t the AQI on AirCare and other websites match?
This is normal and expected. There are many variations of AQI across the world: EAQI, CAQI, US AQI, China AQI... so every app and website may use a different one to represent data.
AirCare uses the new European AQI (EAQI) model in Europe, and US AQI in the US, where for each pollutant, we take the one with the highest concentration and put it on a scale of 1 to 100 for the EU, and 1 to 500 for the US (where 100% is the maximum upper limit of that polluter).
If you wish to compare data between apps/sites, please compare the raw pollutant data like PM 10 or PM 2.5 instead.
- Version8.91.010
- UpdateSep 25, 2025
- DeveloperAirCare by EarthCare
- CategoryWeather
- Requires AndroidAndroid 5.0+
- Downloads208K+
- Package Namecom.gorjan.airquality
- Signature92122aec791d3d33a5b8f1b594c24d54
- Available on
- ReportFlag as inappropriate
-
NameSizeDownload
-
58.13 MB
-
57.12 MB
-
58.55 MB


User-friendly interface and design.
Accurate data from multiple sources.
Useful for alerts on air quality issues, especially during wildfires.
Offers a consistent reading for air quality, which is critical for individuals with asthma or allergies.
The app has a widget feature for quick access to information.
Supports multiple languages.
Provides information for various regions.
Helpful in reducing unnecessary worries about air quality.
Alerts for air quality changes based on location.
Frequent crashes with the latest version.
Inaccurate data compared to reliable sources like PurpleAir.
Many features locked behind a paywall.
Slow map performance during high traffic or bad weather events.
Notifications may provide irrelevant air quality alerts for distant locations.
Complex search functionality and unclear user interface.
Limited geographic coverage for air quality monitoring.
Updates often introduce bugs or reduce usability.
Issues with persistent settings and user preferences.